1156
Proceedings of the 18
th
International Conference on Soil Mechanics and Geotechnical Engineering, Paris 2013
The SWRC is dependent on various physical, chemical,
mineralogical and mechanical properties. One factor that
influences the SWRC is the initial water content. Many studies
have been put forward in recent years on the effect of the initial
water content on SWRC, mainly considering SWRCs following
drying paths. Vanapalli et al. (1999) observed the influence of
compaction in soil samples at different levels (at optimum, wet
and dry of optimum water contents). Where, the SWRC
following a drying path was determined for samples dry of
optimum, it was found to be steeper than the SWRC at optimum
or wet of optimum. The attributed reason was that the samples
tested dry of optimum have a highly aggregated macro
structure, thus resembled the behaviour of coarser material.
However, the micro structure governs the SWRC wet of
optimum (as soils are unlikely to be aggregated in this
condition). It has been observed that at high suctions all SWRCs
seem to converge to a single curve. Studies have been
conducted by Marinho and Chandler (1993), Ng and Pang
(2000), Birle et al. (2008), among others, that have shown that
the SWRCs are greatly influenced by the initial water content.
In this paper a series of suction measurements using filter
paper tests is presented that were carried out on remoulded
samples of a sandy clay soil. Soil samples were prepared with
different initial water contents (10%, 13%, 15%, 20% and 22%)
and dynamically compacted that were then used to perform the
filter paper tests. Other samples were wetted or dried to reach
the other water contents for testing. The results obtained were
then compared with the soil water retention curve (SWRC) for
this material drying from a saturated state.
2 MATERIALS AND METHODS
2.1
Material properties
The soil material used in this study was glacial till sourced from
a stock pile in County Durham, UK. From the particle size
distribution shown in Figure 2, the soil material is classified as
well graded sandy clay. As for the index properties, the liquid
and plastic limits were found to be 43.3% and 23.7%
respectively, meaning a plasticity index of 19.6.
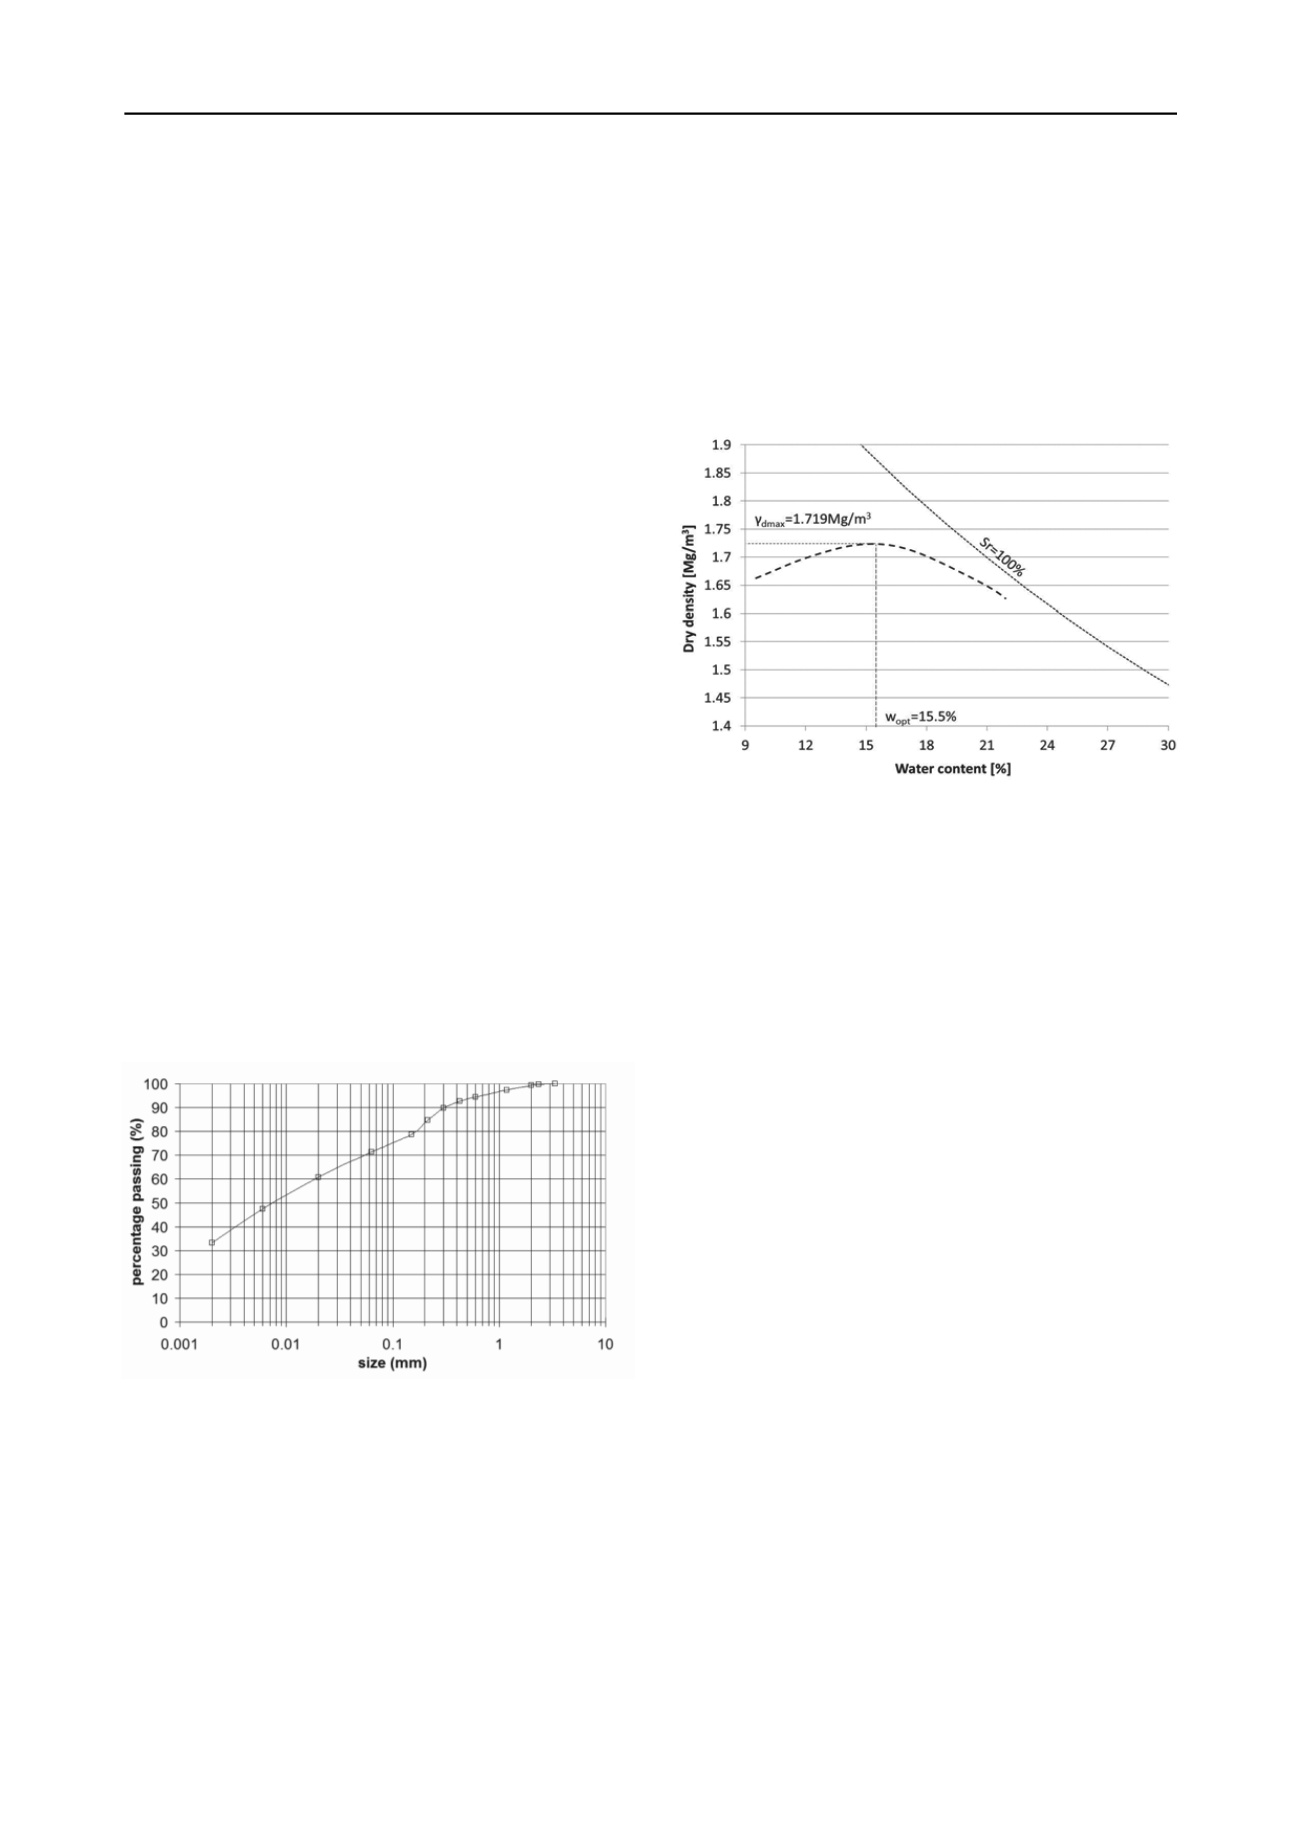
Figure 2. Particle size distribution curve of the sieved material.
Due to the variability in sample preparation, observed in
preliminary tests, the soil material was sieved to a maximum
particle size of 2.80mm to remove occasional gravel sized
particles. The resulting compaction curve is shown in Figure 3,
where the optimum water content was found to be 15.5% at a
maximum dry density of 1.719Mg/m
3
.
2.2
Sample preparation
Samples with size 100mm in diameter and 200mm in height
were dynamically compacted after preparation at 5 different
water contents: 10%, 13%, 15%, 20% and 22%. Subsequently,
subsamples were trimmed down to discs with 55mm in diameter
and 20mm in height.
For testing purposes, discs with similar water content were
later dried or wetted to other water contents (e.g. subsamples at
an initial water content of 15% were dried to 10% or 13% and
wetted to 20% or 22%). The drying procedure used was air
drying, while the wetting procedure was conducted inside an
humidifying chamber. In both cases, after the subsamples had
reached the target water content, they were sealed off for a
period of at least 5 days for water content homogenization.
Detailed information on these procedures can be found in
Mendes (2011).
Figure 3. Compaction curve obtained for the sieved material.
2.3
Filter paper technique
The filter paper technique was used to determine the soil
suction. This technique can measure soil suction either by
vapour flow (non-contact filter paper – total suction) or by
liquid flow (contact filter paper – matric suction). This
measurement is achieved by letting the soil-filter paper system
to reach equilibrium. When this equilibrium is reached the
measurement of soil suction can be determined. The major
advantages of the filter paper technique are the wide measuring
range, from 0 up to 30MPa, and low cost. The major drawbacks,
however, are the long term equalization period (5 to 14 days)
and the quality of the measurement, which is dependent on the
experience of the user and also on the calibration curve that
relates the water content of the filter paper to suction.
The method for the filter paper technique used in this work
was adapted from Bulut et al. (2001) for the measurement of
soil matric suction. Three filter papers, in this case Whatman
42, were placed in intimate contact between two sample discs of
similar water content, as shown in Figure 4. The outermost filter
papers were used to prevent contamination from soil particles
and the middle filter paper was used for the measurement. The
whole setup, filter papers and disc samples, was sealed with
electrical tape to prevent contact between the filter papers and
air and placed inside a glass jar. The jar was later wrapped in
plastic film, coated in paraffin wax and submerged in a water
bath at 25
o
C for an equalization period of 14 days. After the
equalization period, both sample discs and filter paper were
quickly removed from the glass jar in order to determine the
filter papers’ wet mass to a level of accuracy of 0.0001g. These
were later oven dried for determination of the water content.
The water content of the filter paper was then used to determine
the corresponding suction, by means of a calibration curve,
associated with the known water content of the sample discs.
Based on the work of Noguchi et al. (2011) it was found
that the calibration curve that gave a best match for this
particular soil was that obtained by van Genuchten (1980) in the
form of equation (1).


