1153
Technical Committee 106 /
Comité technique 106
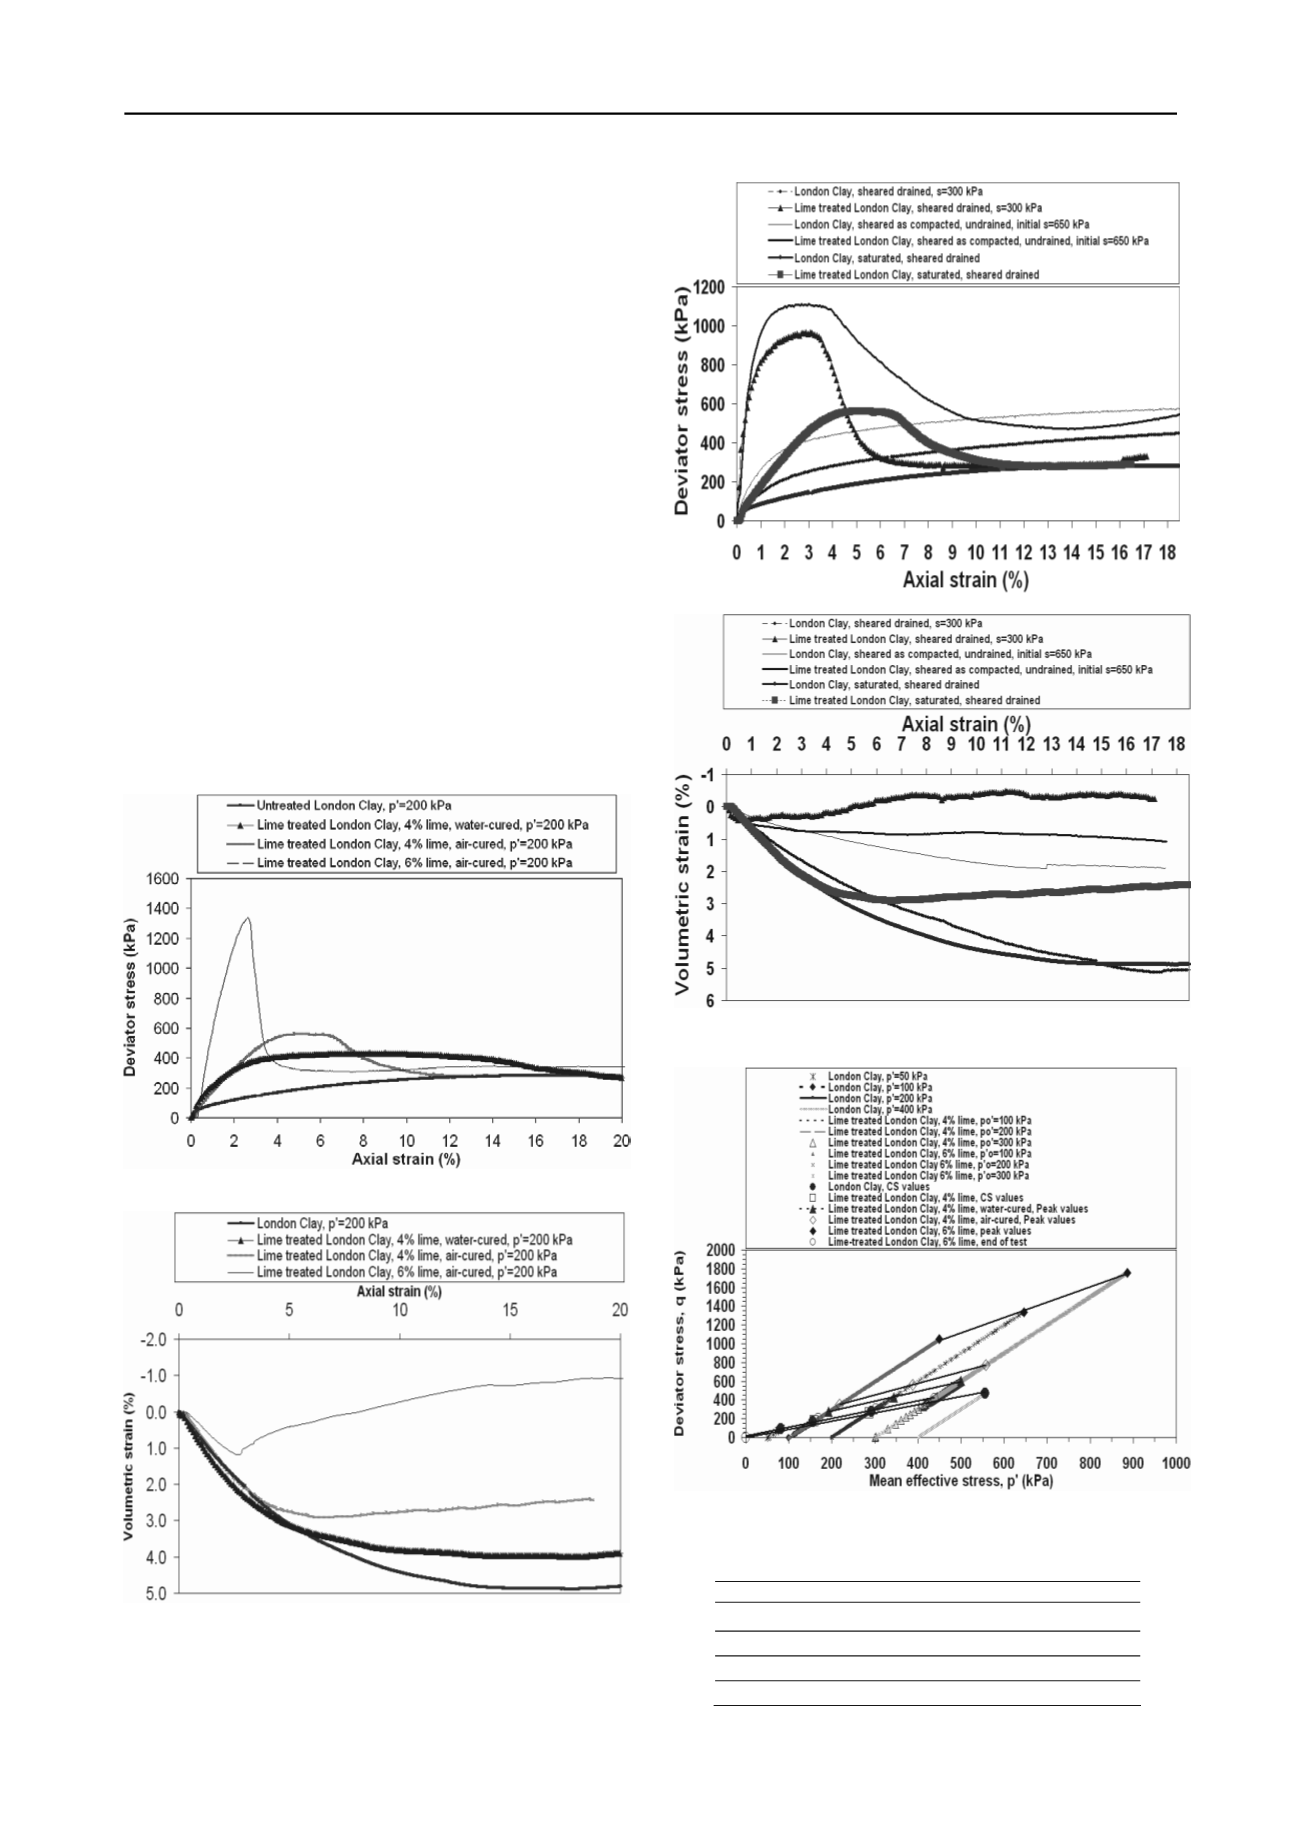
Figure 6 shows the stress path plots in the q:p’ plane together
with the peak (applicable to lime treated soil only) and critical
state lines. As for 4% lime the values of M for the lime treated
and untreated London Clay were very close irrespective of the
mode of curing, it was concluded that both types of soil
converged on the same Critical State line in the q:p’ plane with
M=0.88 (see Fig. 6), i.e. a critical state angle of friction
φ’
cr
=22.5º, consistent with values reported in the literature for
London Clay. This implies that this lime content does not
appear to have modified the frictional properties of the material.
For 6% lime, M and consequently the critical state friction angle
were slightly higher (1 and 25.4º respectively), presumably due
to the formation of a greater amount of cementing material (due
to pozzolanic reactions induced by the surplus of lime above the
ILC) coating the particles. The collective characteristics of the
soils from the shearing stage are shown in Table 1. The
compressibility behaviour of the soils was difficult to assess
fully due to the limited range of isotropic compression
pressures. The results were complemented with data from K
0
compression using equipment that achieved a range of confining
pressures up to 2000 kPa. Even so, full destructuration of the
material did not occur. For the ranges of confining pressure
considered the increase in stiffness upon lime treatment was
very considerable (for instance for the 4% water-cured soil
λ=0.05 whereas for the untreated soil λ=0.14). Consequently,
during compression lime-treated samples maintained for the
most part higher specific volumes
v
than untreated samples
(although the latter started with higher
v
due to swelling).
(a)
(b)
Figure 4. Indicative triaxial testing results (saturated soil): (a) q:ε
a
results (b) ε
v
:ε
a
results
(a)
(b)
Figure 5. Indicative triaxial testing results (unsaturated soil, tests
performed at a net stress of 200 kPa): (a) q:ε
a
results (b) ε
v
:ε
a
results
Figure 6. Drained triaxial testing (saturated soils): Stress paths and
Critical State and peak state lines in the q:p’ plane
Table 1. Collective soil properties derived from the triaxial tests.
Soil
c’
φ'
peak
φ'
c
M
untreated
0
N/A
22.5
0.88
4% lime water cured
38
26.5
22.5
0.88
4% lime, air cured
39
30.7
22.5
0.88
6% lime, air cured
170 39.9
25.4
1


