1144
Proceedings of the 18
th
International Conference on Soil Mechanics and Geotechnical Engineering, Paris 2013
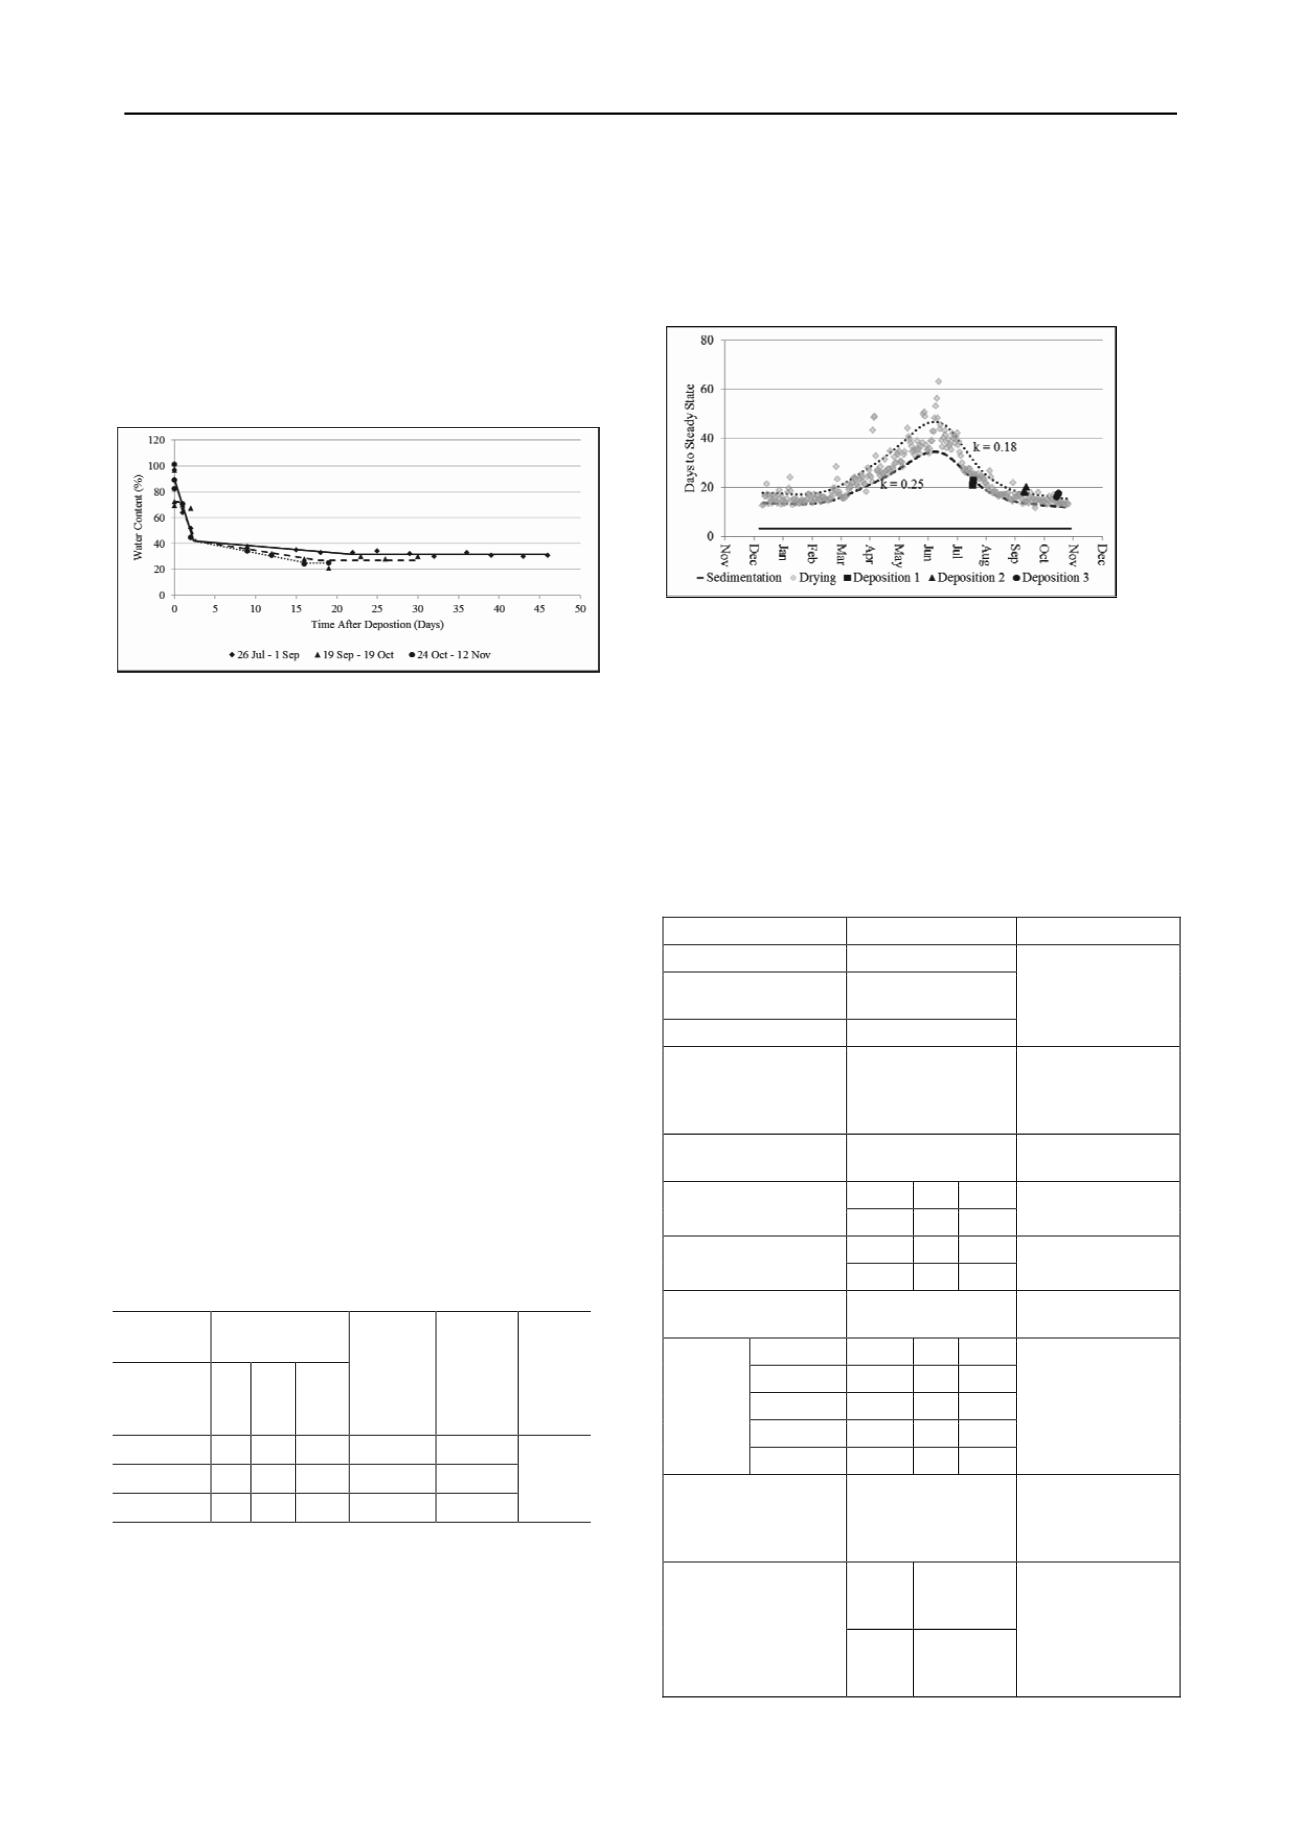
final water content of 41 % (1.3 % standard deviation). The
water released during sedimentation is available for recovery.
Similarly the rate of drying was determined by linear
regression using the water contents following sedimentation,
surface samples recovered during the drying stage, and the
average steady state value. Figure 1 shows a composite graph of
the sedimentation, drying and steady state curves with
respective raw data at 50 m along the beach. The rates of drying
for the respective depositions along the beach are given in Table
2.
Figure 1. Regression curves at sampling point 50 m along beach
2.2
Reference Evapotranspiration
Reference Evapotranspiration (ET
0
), a measure of
macroclimatic evaporative energy, was calculated using
methods outlined in Allen et al (1998). Climatic data from the
Mokopane weather station maintained by the South African
Weather Bureau was used to develop a regional calibration of
the Hargreaves method based on the Penman-Monteith method.
The calibrated Hargreaves method was then used to calculate
ET values for the test site.
0
An A-Pan was also maintained, however although results
agreed with ET
0
values a great deal of scatter was observed.
This is considered a consequence of variable microclimatic
conditions on the dams and operational constraints.
2.3
Empirical Correlation
In order to enable the correlation to be compared with other
sites it was necessary to correlate the rate of drying with a
macroclimatic measure of evaporative energy. This is
independent of the dam surface microclimate that resulted in
scattered A-Pan data.
Table 2 shows the values used to develop the empirical
correlation defined by the k – value. This is the ratio between
the change in water content per day and average daily ET
0
value
during the drying stage.
Table 2. Development of empirical correlation
Deposition ↓ Change in water
content per day
Distance
along
beach →
0 m 50 m 100 m
Average
daily ET
0
(mm·day
-1
)
Combined
k – value
per
deposition
Average
k – value
1
0.96 0.54 0.71
3.0
0.25
2
1.24 0.98 0.87
5.3
0.20
3
1.03 1.23 0.88
5.9
0.18
0.21
During winter as the evaporative energy is lower, more
moisture may be lost through seepage with the opposite being
the case during summer. It is also likely that this water bleeds
up to the surface as the material consolidates and is recovered.
This is illustrated by the k – values being slightly higher during
winter and lower during summer but a longer study would be
required to quantify this variation.
Figure 2 illustrates the time required for the sedimentation
step and then, using the average k – value, the number of days
to reach steady state based on daily ET
0
values. Such
relationships can be used to optimise the safe development of
tailings dams.
Figure 2. Predicted drying behaviour
2.4
arises these results
dy state.
Table 3
cal Parameters
D
Steady State
The steady state after drying was investigated by analysing
auger samples taken at 200 mm intervals to a depth of 1 m
increasing to 2.5 m as the study progressed. Within the time
frame of sampling following drying of each test deposition no
trend of water content with time was observed. Rather values
varied from sample date to sample date within a narrow
distribution. To investigate this steady state various laboratory
tests were done. This was supplemented by computer analysis
and predictive modelling. Table 3 summ
wh
re used to assess the stea
ich we
. Geotechni
Parameter
Value
etermination
Air Entry Value
27 %
Peak
sity
Dry Den
(kg•m
-3
)
1 700
Porosity
0.48
Shr
es
Laboratory
determined
Volumetric
inkage Curv
Field Capacity, at 33
ler & D
kPa (Mil
onahue, 21 %
ard
deviation)
de
Wa
nt
1990)
(4.3% stand
Laboratory
termined Suction-
ter Conte
Curves
Saturated Hydraulic
Co
-1
)
r
nductivity (m•s
7.5 ×10
-8
Triaxial tests on
emolded samples
Min Max Ave
Liquid Limit
20
25
23
Casagrande cup
BS1377:Part 2 (1990)
Min Max Ave
Plastic Limit
BS1377:Par
18
21
29
t 2 (1990)
Particle Specific G avity 3.10
ard
BS1
90)
r
(0.03 stand
deviation)
Vacuum method
377:Part 2 (19
Min Max Ave
Dam 1, D
60
20
60
31
Dam 1, D
10
1
4
2
Dam 2, D
60
21
30
26
Grading
ramete
Pa
rs
(µm)
1
4
2
distribution curves.
Dam 2, D
10
Particle size
corresponding to 60
% and 10 % passing
on the particle size
Residual Volumetric
ater Content, at 1500
W
kPa (van Genuchten,
4.6 %
W
1980)
Laboratory
determined Suction-
ater Content Curve
Dam 1
22 % (6 %
standard
deviation)
Field Capacity, Water
Content at a Hydraulic
Conductivity of 10
-11
Meyer &
m•s
-1
(
Gee,
m
t
param r each
1999)
Dam 2
deviation)
dam.
23 % (4 %
standard
Modified Kovács
ethod (Aubertin e
al, 2003) on full
range of grading
eters fo
The mean water content for the entire 11 month data set
from both dams was 27 % (Standard deviation of 6 %). This


