1135
Technical Committee 106 /
Comité technique 106
conductivity of finer soil and coarser soil respectively, and
k
f
is
larger than
k
c
.
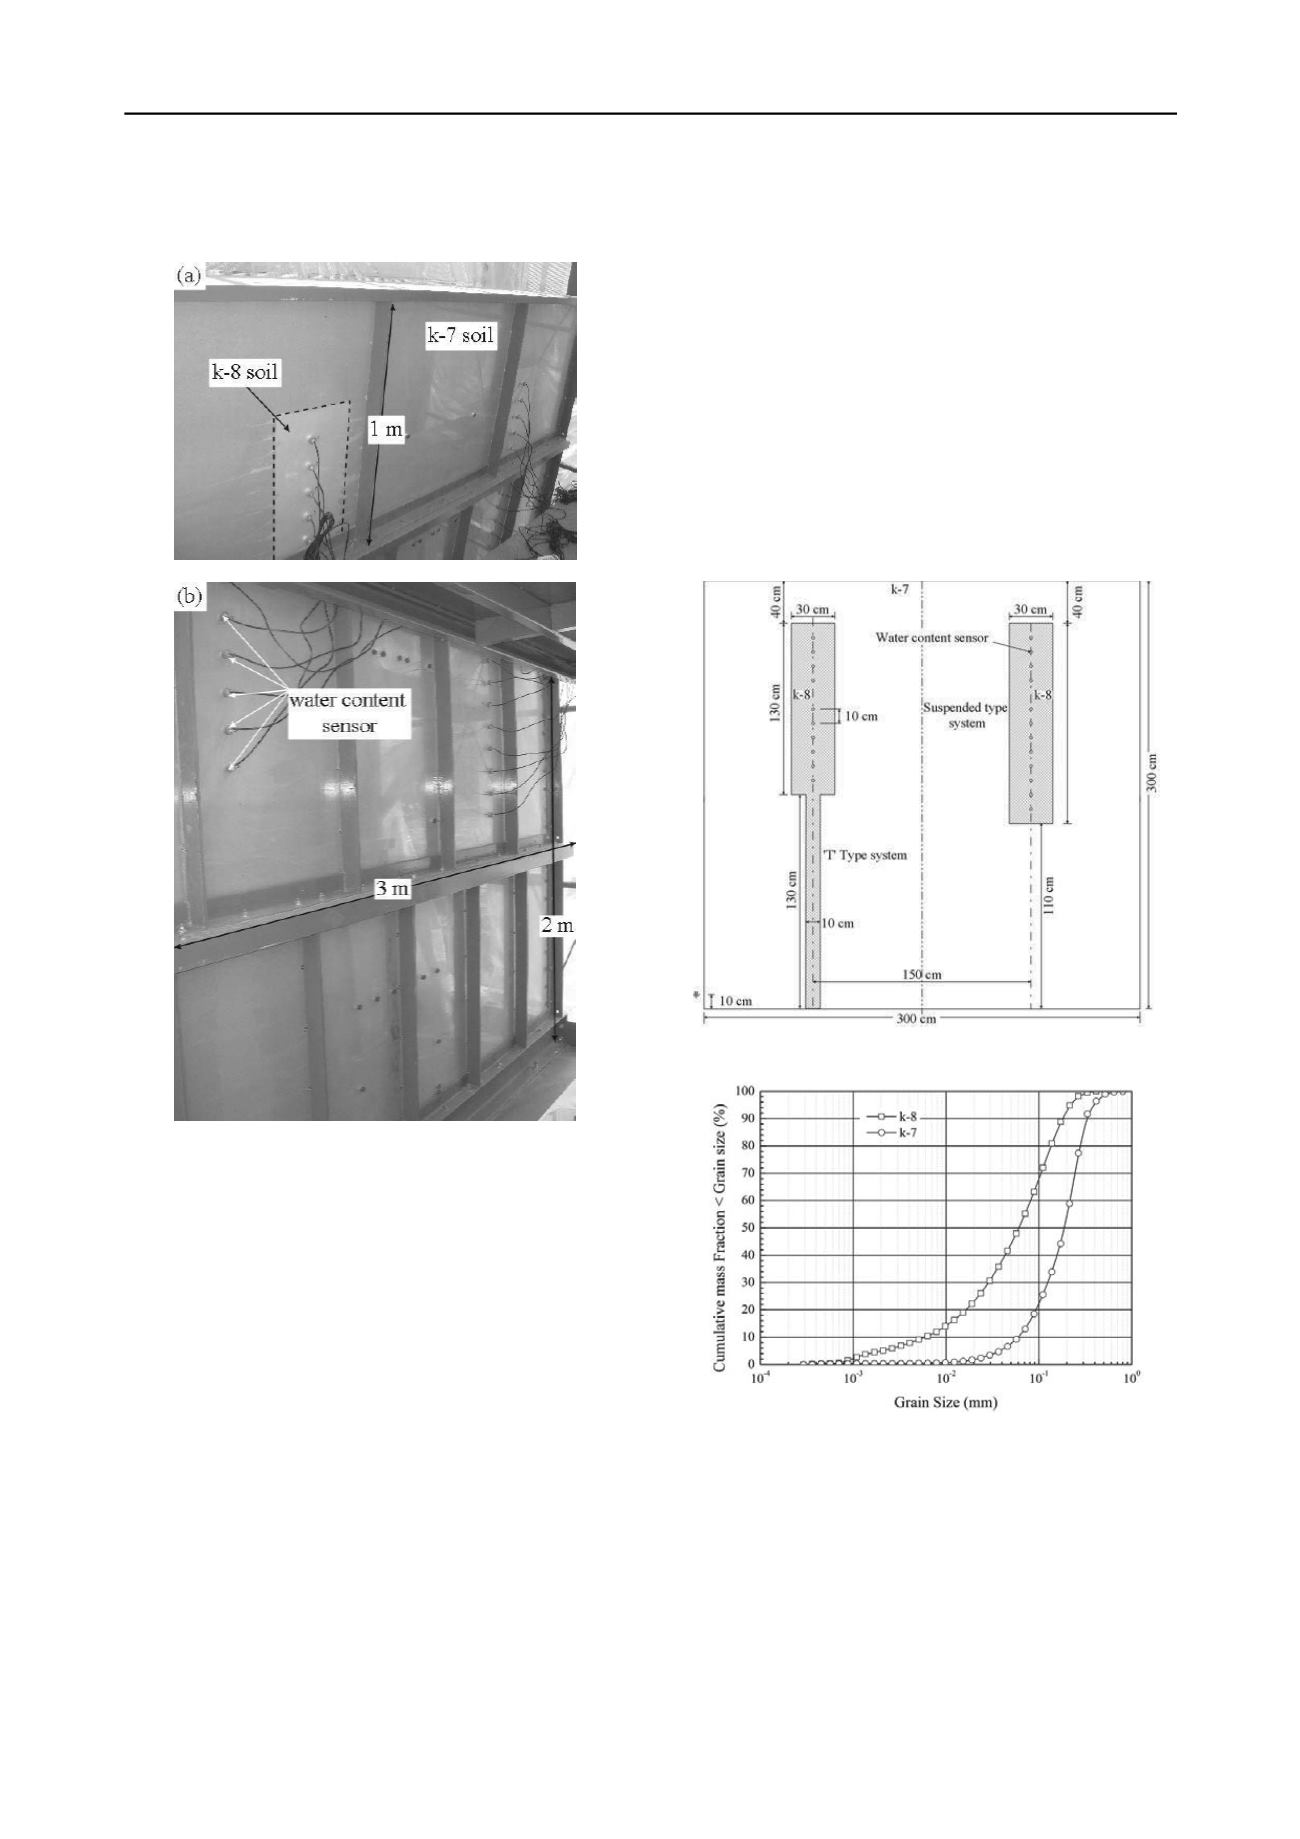
Figure 4 Picture of the model test. (a) 2-3 m. (b) 0-2 m.
3 VERIFICATION OF SYSTEM
Based on the design method mentioned above, this section will
give out a design case by using the k-7 soil and the k-8 soil. In
here, the k-7 soil and k-8 soil are used to simulate the coarser
soil and the finer soil respectively. Both model test and
numerical simulation are performed to verify the design.
3.1
Model Test
As shown in Figure 4, the model test is conducted within a steel
chamber (300 cm × 300 cm × 25.5 cm). Figure 5 shows the
schematic view of the setup of the model test. The left side of
the figure shows the setup of the ‘T’ type system. The right side
of the figure shows the setup of the suspended type system.
According to the soil water retention curve of the k-7 soil
(Figure 3), the water entry value is around 12 kPa. Therefore, at
critical condition, the plate part of the ‘T’ type system is laid at
120 cm above the water level. Based on the observation of
evaporation test, the maximum effective depth of evaporation is
assumed as 40 cm, and then the thickness of the plate part is
determined as 130 cm. The width of the pillar part is set as 10
cm, the ratio of radius is set as 1:3, and then the size of the ‘T’
type system can be determined. Considering the effect of
interaction of the interface, the height of suspended type of the
system is laid at 100 cm above the water level. Based on the
same assumption of the maximum effective depth of
evaporation, and then the thickness of fine layer is determined
as 150 cm. in order to keep the consistency with the ‘T’ type
system, the width of the finer layer is set as 30 cm. Figure 6
shows the grain size distribution of soils used in this study.
3.2
Numerical Verification
Figure 7 shows the FEM mesh of the numerical model. As
shown in the figure, the model set-up follows the experiment
work described above, in which the upper boundary is
atmospheric condition. The lower boundary was assigned to
condition of constant saturated water content. The FEM column
was discretized uniformly, except the area, where fine layer
exits, was discretized in to small triangular mesh. A number of
observation points were located at different elevations as the
location of water content sensor in physical model.
Figure 5 Profile of the model test.
Figure 6 Grain size distribution of the soils
Figure 8 shows the comparison between test result and
numerical result. As shown in the figure, several observations
can be obtained. First of all, the self-watering system in both ‘T’
type and suspended type can absorb the water from the bottom
and store the water in higher part of the system. Secondly, there
is a good consistency between the test result and numerical
result. It means that the numerical method can be used as one
tool to predict the unsaturated water flow in the self-watering
system.


