1138
Proceedings of the 18
th
International Conference on Soil Mechanics and Geotechnical Engineering, Paris 2013
defined as a cross-section of two logarithmic lines as shown
in Figure 1 (Fredlund and Xing, 1994).
Shape of SWRC is defined by suction at AEV and at residual
suction and is typical for type and density state of the soil.
Zapata et al. (2000) showed among others the influence of soil
index properties on the shape of SWRC. Kawai et al. (2000)
showed the importance of void ratio and Vanapalli et al. (1999)
showed the influence of soil structure on SWRC. If good and
representable SWRC is to be measured, all these things should
be considered.
Figure 1. Soil-water retention curve with zones of desaturation (Sillers
et al., 2001).
3
SOIL SUCTION MEASUREMENTS
3.1
HYPROP evaporation method device
The evaporation method is frequently used method for
measuring both the SWRC and the suction permeability curve.
The method is based on the measurements of suction using
tensiometers installed at different heights inside the soil
specimen simultaneously with measuring the specimen weight
changes due to the evaporation of water from the specimen. Due
to large number of measurements a continuous SWRC is
obtained. After the simplified evaporation method (Schindler,
1980) only the average weight and suctions at two points are
measured. Due to short time interval the spatial and temporal
nonlinearity are negligible. Therefore, two assumptions can be
made:
there exist quasi steady state conditions, which means that
flux and hydraulic gradient are constant over the time
interval, and
the linear decreasing of water content and linear decreasing
soil suction. This means that soil suction in the middle of
the specimen is an average suction measured by tensiometer
and that water content in the middle of the specimen is the
same as the average water content.
Schindler and Müller (2006) had shown that these two
assumptions are valid only if the evaporation rate is constant. If
the evaporation rate is decreasing, the suction profile is not
linear. Peters and Durner (2008) studied the error made by these
two assumptions in the final clearly non linear zone and showed
that errors made by linear approximation are negligible.
3.1.1
HYPROP device preparation
High capacity tensiometers for the HYPROP device are
saturated and preconditioned by cycles of deairing at vacuum
(app. 92 kPa) and by the applying normal atmospheric pressure.
As the deionised water is used, due to the small water volume
and the special preconditioning, suction over 400 kPa can be
measured with HYPROP device (Schindler et al., 2010). At the
tests described in this paper only suctions up to 150-200 kPa
could be reached by same preconditioning.
3.1.2
Sample preparation
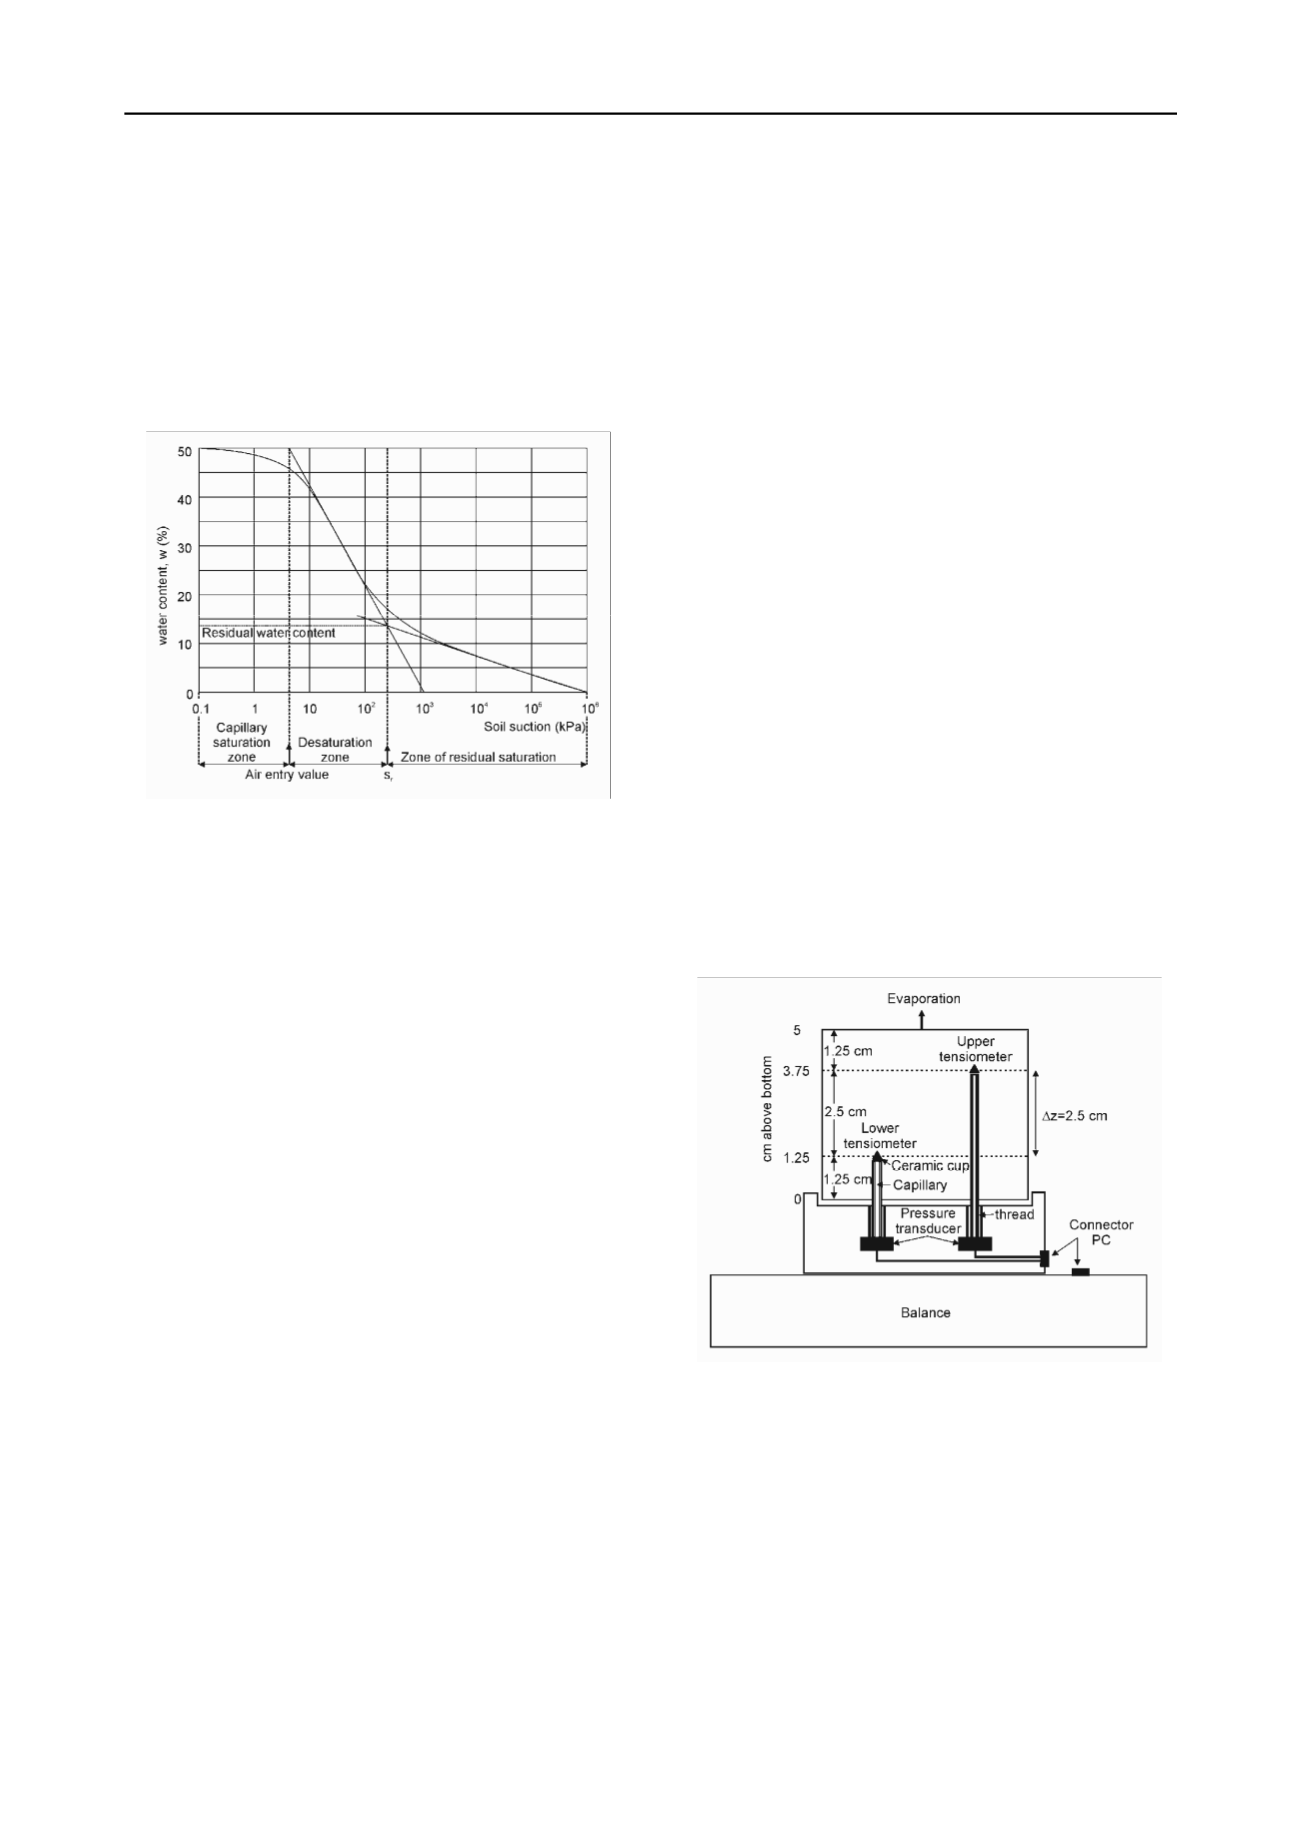
A sampling steel cylinder of known weight and volume was
pushed into the undisturbed or in the laboratory prepared,
compacted sample. The overlapping soil along the ring’s rim
was cut by a sharp knife. Special care should be taken not to
smear the pores at the surfaces, as this would increase AEV of
the top soil surface. The HYPROP device uses sampling ring
with a height of 5 cm and a diameter of 8 cm (Figure 2).
The specimen in the ring is then saturated by immersing it in
water. Volume changes are prevented by porous stones on both
ends and with the weight of 10 kPa applied on top of the
specimen. Better saturation can be achieved when the specimen
is saturated under vacuum.
3.1.3
Measurement
Into a saturated soil specimen two boreholes are drilled and in
these two boreholes the tensiometers from HYPROP device are
installed. The saturated specimen with the HYPROP device is
put on a balance and the measurements start. The suction on
both tensiometers and the weight change of the specimen are
recorded simultaneously every 10 minutes. In the first stage
when the water tension in tensiometers is increasing, the
readings are in good correlation with the soil suction at the
location of the tensiometer. In the second stage the cavitation
inside the tensiometer appears and the tensiometer readings are
more or less constant. Due to upward tensiometer direction only
a small amount of water is drowned into the soil specimen. In
the 2
nd
stage the soil suction is higher than the water tension
measurements. When the suction in the soil increases over the
AEV of the porous cap, air comes into the tensiometer and the
water tension inside the tensiometer collapses. When suction in
both tensiometers collapses, measurements are finished and the
water content and the dry density of the specimen are measured
using the standard procedures. The duration of the whole test is
between 1 and 2 weeks.
Figure 2. Schematic cross section trough HYPROP evaporation method
device (Schindler et al., 2010).
3.1.4
The extension of measurements
The basic idea for extending the measurement range is to use
the ceramic cap AEV (Schindler et al., 2010). At this point the
air comes to tensiometer and the water tension rapidly collapses
to 0 kPa. The soil suction should be the same as AEV of the
tensiometer’s ceramic cap. If this assumption is valid, an
interpolation by high order polynomial functions of suction
between stage 1 and this point can be performed (Figure 3).
By applying this procedure to both tensiometers the
measured data can be extended to higher suctions (up to 800
kPa).
Unlike Schindler et al. (2010) only the average suction of
both tensiometers at the point of tension collapse of the top


