1132
Proceedings of the 18
th
International Conference on Soil Mechanics and Geotechnical Engineering, Paris 2013
content, similar to degree of saturation. Permeability of
compacted soil shown in Figure 1 is defined from stable flow on
compacted soil under certain hydraulic gradient. Since lower
permeability appears on the drier and denser specimen, the
minimum permeability should appear under the optimum water
content. However, the minimum permeability actually appears
in the region over the optimum water content. It is assumed that
this tendency can be attributed to distribution of degree of
saturation and void ratio around the optimum water content
shown in Figures 13 and 14. Figure 15 shows distribution of
void ratio within the specimen compacted to dry density of
around 1.55 (g/cm3). When we construct the embankment, dry
density is specified for measurement standards after track
maintenance work. However, from Figure 15 it is found that the
distribution of void ratio varies according to compaction load
and water content, even on the specimen with the same dry
density.
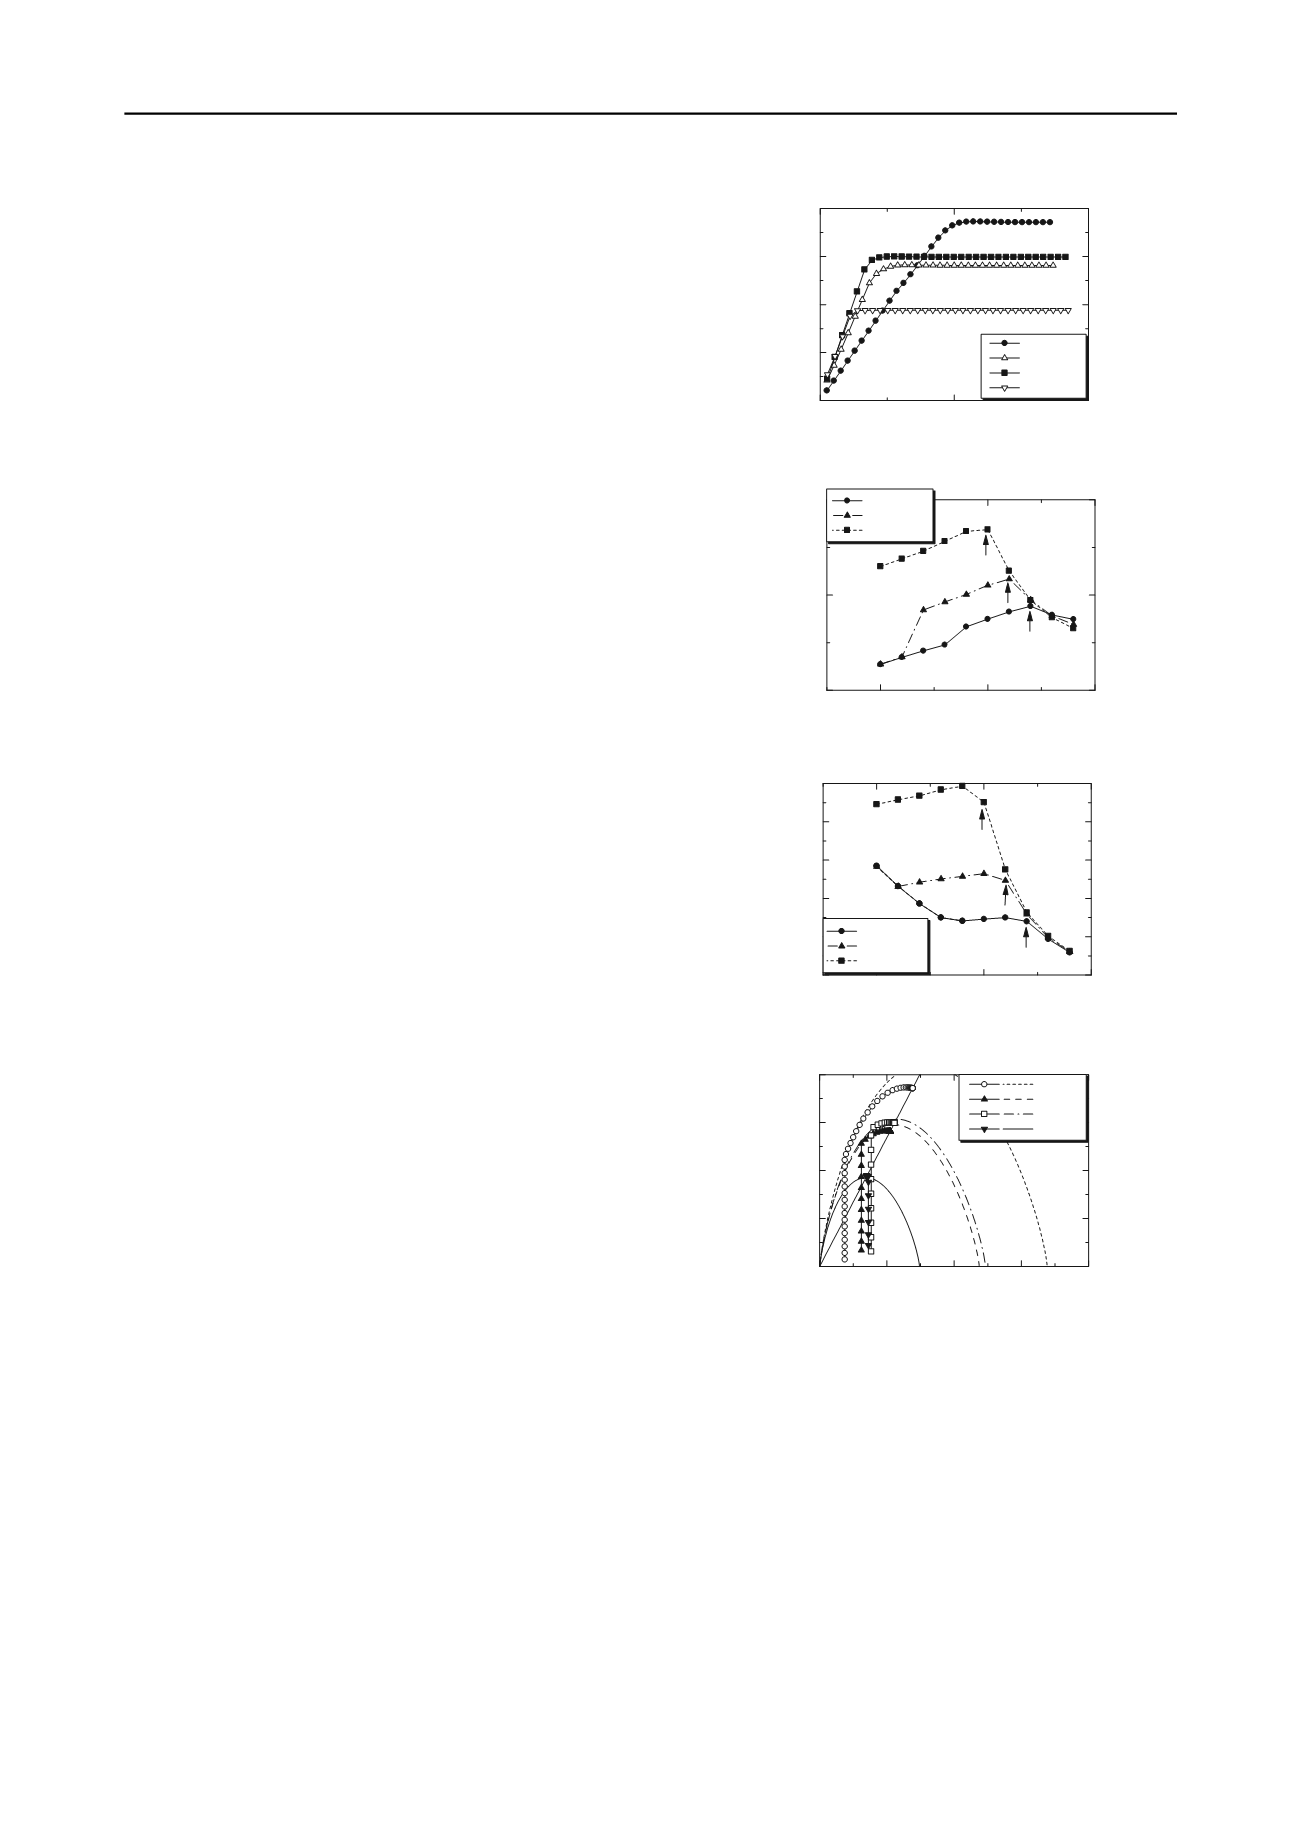
Figure 16 shows the relationship between water content and
yield stress of the compacted specimen in the unsaturated state,
c
sat
p p
. Arrows in the figure indicate the optimum water
contents of compaction curves. The yield stresses of the
specimens compacted under 800 and 1600 (kPa) in the region
with low-water content are overestimated due to characteristics
of the constitutive model. Consequently, the peaks for yield
stresses appear in the region that is little drier than the optimum
water content (shown in Figure 19), and the simulation results
agree with the experimental behavior.
4.2
Simple shear simulation on compacted specimen
Figure 17 shows the relationship between shear strain and shear
strength on the specimen obtained from static compaction
simulations in simple shear simulations. Figure 18 shows elastic
shear modulus read from the specimen in Figure 17. The arrows
in the figure indicate the optimum water contents of compaction
curves where it is found that elastic shear modulus depends on
dry density. However, the peaks of shear strength appear in the
region that is little drier than the optimum water content (shown
in Figure 19). This is attributed to the yield surface. Figure 20
shows the stress paths during shear. In the figure, the initial
yield surfaces are drawn. The stress path reaches to the dry side
of the yield surface first and is then bound for the critical state
with strain softening. The size of the yield surface depends on
plastic volumetric strain and degree of saturation. The former
factor is related to dry density and the latter factor is related to
water content. Additionally, the initial stress state after
compaction depends on suction stress calculated with suction
and degree of saturation shown in Eq.(2). Consequently, the
maximum shear strength appears in the region that is drier than
the optimum water content, as is generally known.
5 CONCLUSIONS
Static compaction and simple shear simulation were conducted
with soil/water/air coupled F. E. analysis code, applying the
constitutive model for unsaturated soil, DACSAR-MP.
Consequently, the shape of the compaction curve and the
characteristics of compacted soil could be reasonably expressed.
This proves that ‘compaction’ can be defined by the initial and
boundary condition problem on unsaturated soil.
Kuno G. 1974. Soil compaction.
JSCE Magazine
59(6), 18-22 (in
Japanese).
0
0.1
0.2
0
100
200
300
400
Deviator stress
q
(kPa)
Shear strain
s
w
=14(%)
w
=18(%)
w
=22(%)
w
=26(%)
Figure 17. Strain-stress relationship on element
○
,
3
under shear
10
20
30
0
10000
20000
Water content
w
(%)
Shear modulus
G
400(kPa)
800(kPa)
1600(kPa)
Figure 18. Water content and elastic shear modulus relationship
10
20
30
0
200
400
600
800
1000
Water content
w
(%)
Shear strength
q
u
(kPa)
400(kPa)
800(kPa)
1600(kPa)
Figure 19. Water content and shear strength relationship
0
200
400
600
800
0
100
200
300
400
Deviator stress
q
(kPa)
Effective means stress
p'
(kPa)
w
=14%
w
=18%
w
=22%
w
=26%
CSL
Figure 20. Stress paths of element
○
,
3
Mualem Y. 1976. A new model for predicting the hydraulic
conductivity of unsaturated porous media.
Water Resources
Research
12(3), 514-522.
Ohno S., Kawai K. and Tachibana S. 2007. Elasto-plastic constitutive
model for unsaturated soil applied effective degree of saturation as
a parameter expressing stiffness.
Journal of JSCE
63(4), 1132-1141
(in Japanese).
6 REFERENCES
Borja R.I. 2004. A mathematical framework for three-phase
deformation and strain localization analyses of partially saturated
porous media.
Computer Methods in Applied Mechanics and
Engineering
193, 5301-5338.
Procter R. R. 1933. Four articles on the design and construction of
rolled-earth dams.
Eng. News Record
111, 245-248, 286-289, 348-
351, 372-376.
Kawai K., Iizuka A., Hayakawa E. and Wang W. 2007. Non-uniform
settlement of compacted earth structures caused by the deformation
characteristics of unsaturated soil on wetting.
Soils and
Foundations
47(2), 195-206.


