1124
Proceedings of the 18
th
International Conference on Soil Mechanics and Geotechnical Engineering, Paris 2013
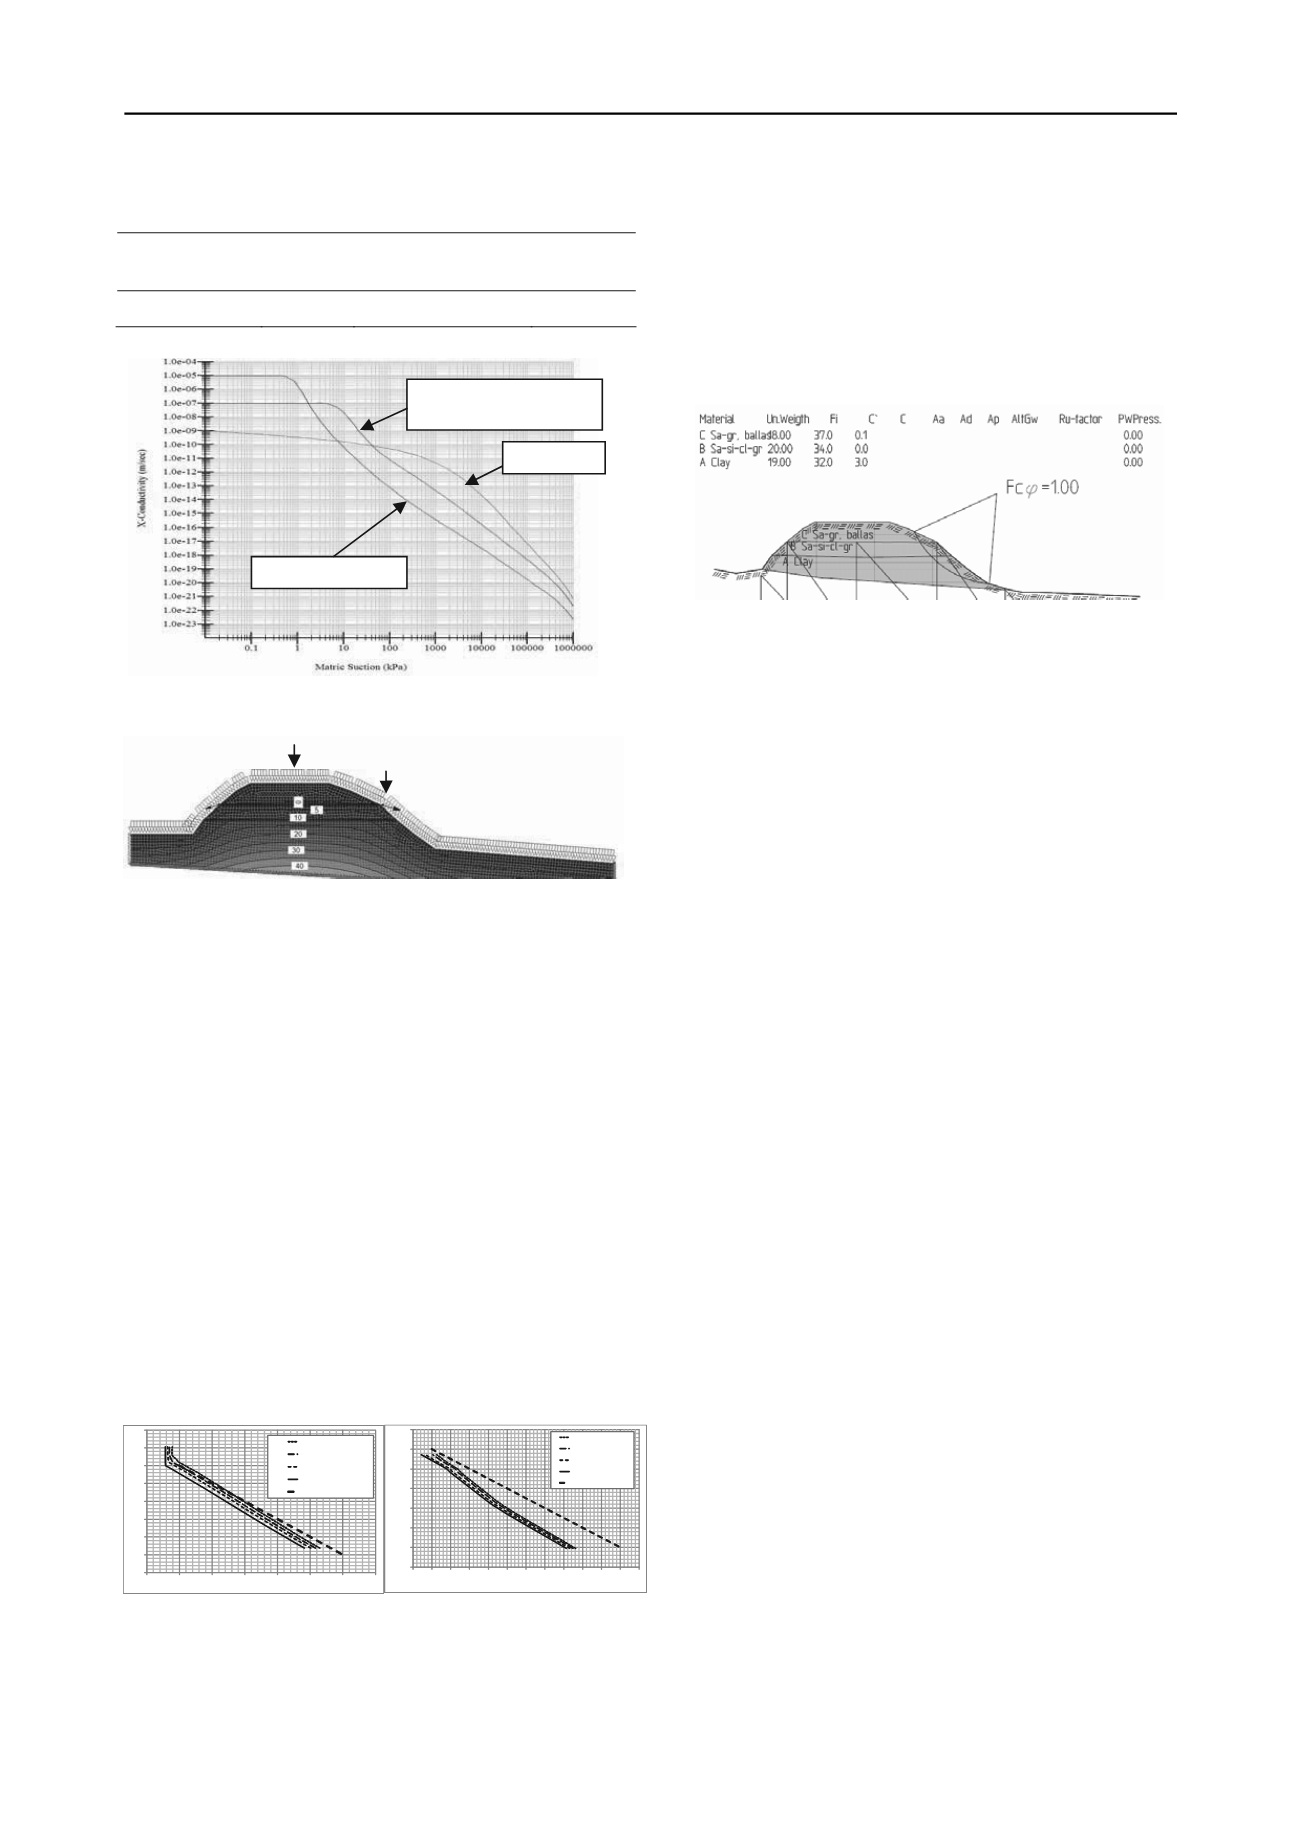
Table 3. Saturated permeability used in seepage calculation
Parameter
Layer A:
clay
Layer B: Sandy, silty,
gravely, clayey mat.
Layer C:
sand/gravel
K
sat
(m/s)
10
-9
10
-7
10
-5
Figure 4. Hydraulic conductivity curves used in seepage analysis for
layers A , B and C.
Figure 5
. Example of flow analysis. Predominantly positive pore-water
pressures. Position of profiles presented in Fig. 6 is indicated.
To get an idea of the range of pore-water pressures resulting
from infiltration seepage analyses were made for varying values
of constant infiltration. Annual rainfall in the region
corresponds to ca. 2.5E-08 m/sec, ~800 mm/year (Norwegian
Meteorological Institute 2011). Runoff will result in infiltration
being smaller than the rainfall. Constant infiltration on the
surfaces of the embankment has been varied between 1.25E-09
and 2.5e-08 m/sec. Results are shown in Fig. 5 for two profiles,
one at the centre and one at the edge of the embankment.
Applied infiltration rates are equal on top of the embankment
and on the slopes. Subsequent analyses reducing infiltration
rates on the slopes did not result in substantially different
results. Seepage boundaries are used to find the extension of
seepage zones at the bottom of the slopes. From the seepage
analyses, it appears that even low infiltration rates produce
positive pore-water pressures in layers A and B. The pore-water
pressures at P1 at the centre of the embankment vary between
80 and 90 % of hydrostatic pore-water pressure for the chosen
range of infiltration rates. For P2 at the edge of the embankment
the pore-water pressures vary between 70 and 75 % of
hydrostatic pore-water pressure.
Figure 6
. Calculated and hydrostatic pore-water pressure vs. depth for
profile P1 (left) and P2 (right) as indicated in Fig. 5.
For positive pore-water pressures, Mohr-Coulomb friction
parameters and the effective stress principal (Terzaghi 1943)
may be used. Stability calculations for the embankment with
positive pore-water pressures from top of layer B result in
critical values the safety factor (~1.0) for realistic choices of
shear strength parameters. In Fig. 7 results are shown for 75-
90% of hydrostatic pore-water pressure distribution from top of
layer B. It is underlined that strength parameters were not
measured. Stability analyses were done by the limit equilibrium
method using the software package GeoSuite Toolbox
(ViaNova Systems 2007).
B: Sandy, silty, clayey,
gravely material
Figure 7
. Stability calculation. 75-90% of hydrostatic pore-water
pressure from top of layer B. Shear strength parameters shown at top.
The soils in the embankment prevent water from being
drained from the construction. The situation probably varies
through the year, and factors not taken into account in the
analyses may improve or worsen the situation. Additional water
may be transported along the embankment from other areas, on
top of the clay layer which may be deformed by settlements, or
by capillary suction in layer B. The particular worry for this
kind of slope stability problem is that there are normally not
clear any precursors to the failure and destabilization of the
embankment is not easily observed.
5 CONCLUSIONS
A: Under-dimensioned, damaged or blocked culverts may result
in rapid destruction of old railway embankments during flash-
floods, which may occur more frequent in the future as a result
of climate change. The problem may be addressed by improved
maintenance/inspection, or by redesign/modernization of the
drainage systems. B: Slope failures may occur in old
embankments constructed of clay, silt, sand and gravel without
clear precursors to failures. Analyses indicate that slope stability
may be critical also without unusual weather conditions. There
seems to be a need for improved research on the geotechnical
behaviour of such embankments.
6 ACKNOWLEDGEMENTS
The financial support from the Norwegian Research Council for
this research project and the help of Peter Gauer, NGI, with
statistical rainfall data is highly appreciated.
7 REFERENCES
Norwegian Geotechnical Association. 1982.
Guideline for symbols and
definitions in geotechnics. Presentation of geotechnical
investigations
(in Norwegian).
Fredlund M.D., Fredlund, D.G. and Wilson G.W. 2000. An equation to
represent grain-size distribution.
Canadian Geotechnical Journal
37, 817-827.
Aubertin, M., Mbonimpa, M., Bussière, B. and Chapuis, R.P. 2003. A
model to predict water retention curve from basic geotechnical
properties.
Canadian Geotechnical Journal
40, 1104-1122.
Norwegian Meterological Institute. 2011. Weather- and climate data.
www
.
eKlima.no
Terzaghi, K. 1943.
Theoretical soil mechanics.
Geo-Slope International. 2007.
Geo-Studio, Version 7.16, build 4840.
ViaNova Systems AS. 2007.
Geo-Slope International. 2007. Novapoint
GeoSuite Toolbox. Stability. Install package: 1.0.27.
A: Clay
C: Sand/gravel
P1
P2
92
93
94
95
96
97
98
99
0
‐10
0
10
20
30
40
50
6
n (m
Pore‐waterpressure(kPa)
10
0
Elevatio
)
q (m/sec)2,50E‐08
q (m/sec)5,00E‐09
q (m/sec)2,50E‐09
q (m/sec)1,25E‐09
u,whydrostatic
92
93
94
95
96
97
98
99
‐5 0 5 10 15 20 25 30 35 40 45 50 55
Elevation (m
)
Pore‐waterpressure(kPa)
q (m/sec)2,50E‐08
q (m/sec)5,00E‐09
q (m/sec)2,50E‐09
q (m/sec)1,25E‐09
u,whydrostatic


