1127
Technical Committee 106 /
Comité technique 106
0
50
100
150
0
100
200
300
400
500
600
Small-strain shearmodulus,Gmax (MPa)
Net confining pressure,(p-u
a
): kPa
s = 400 kPa (RC)
s = 400 kPa (BE)
s = 200 kPa (RC)
s = 200 kPa (BE)
s = 50 kPa (RC)
s = 50 kPa (BE)
G
max
= A(p-u
a
)
B
s : kPa
A
B
R
2
50
3.316 0.535 0.99
200
7.863 0.471 0.98
400
10.988 0.368 0.90
5 DYNAMIC SHEAR MODULUS AND DAMPING
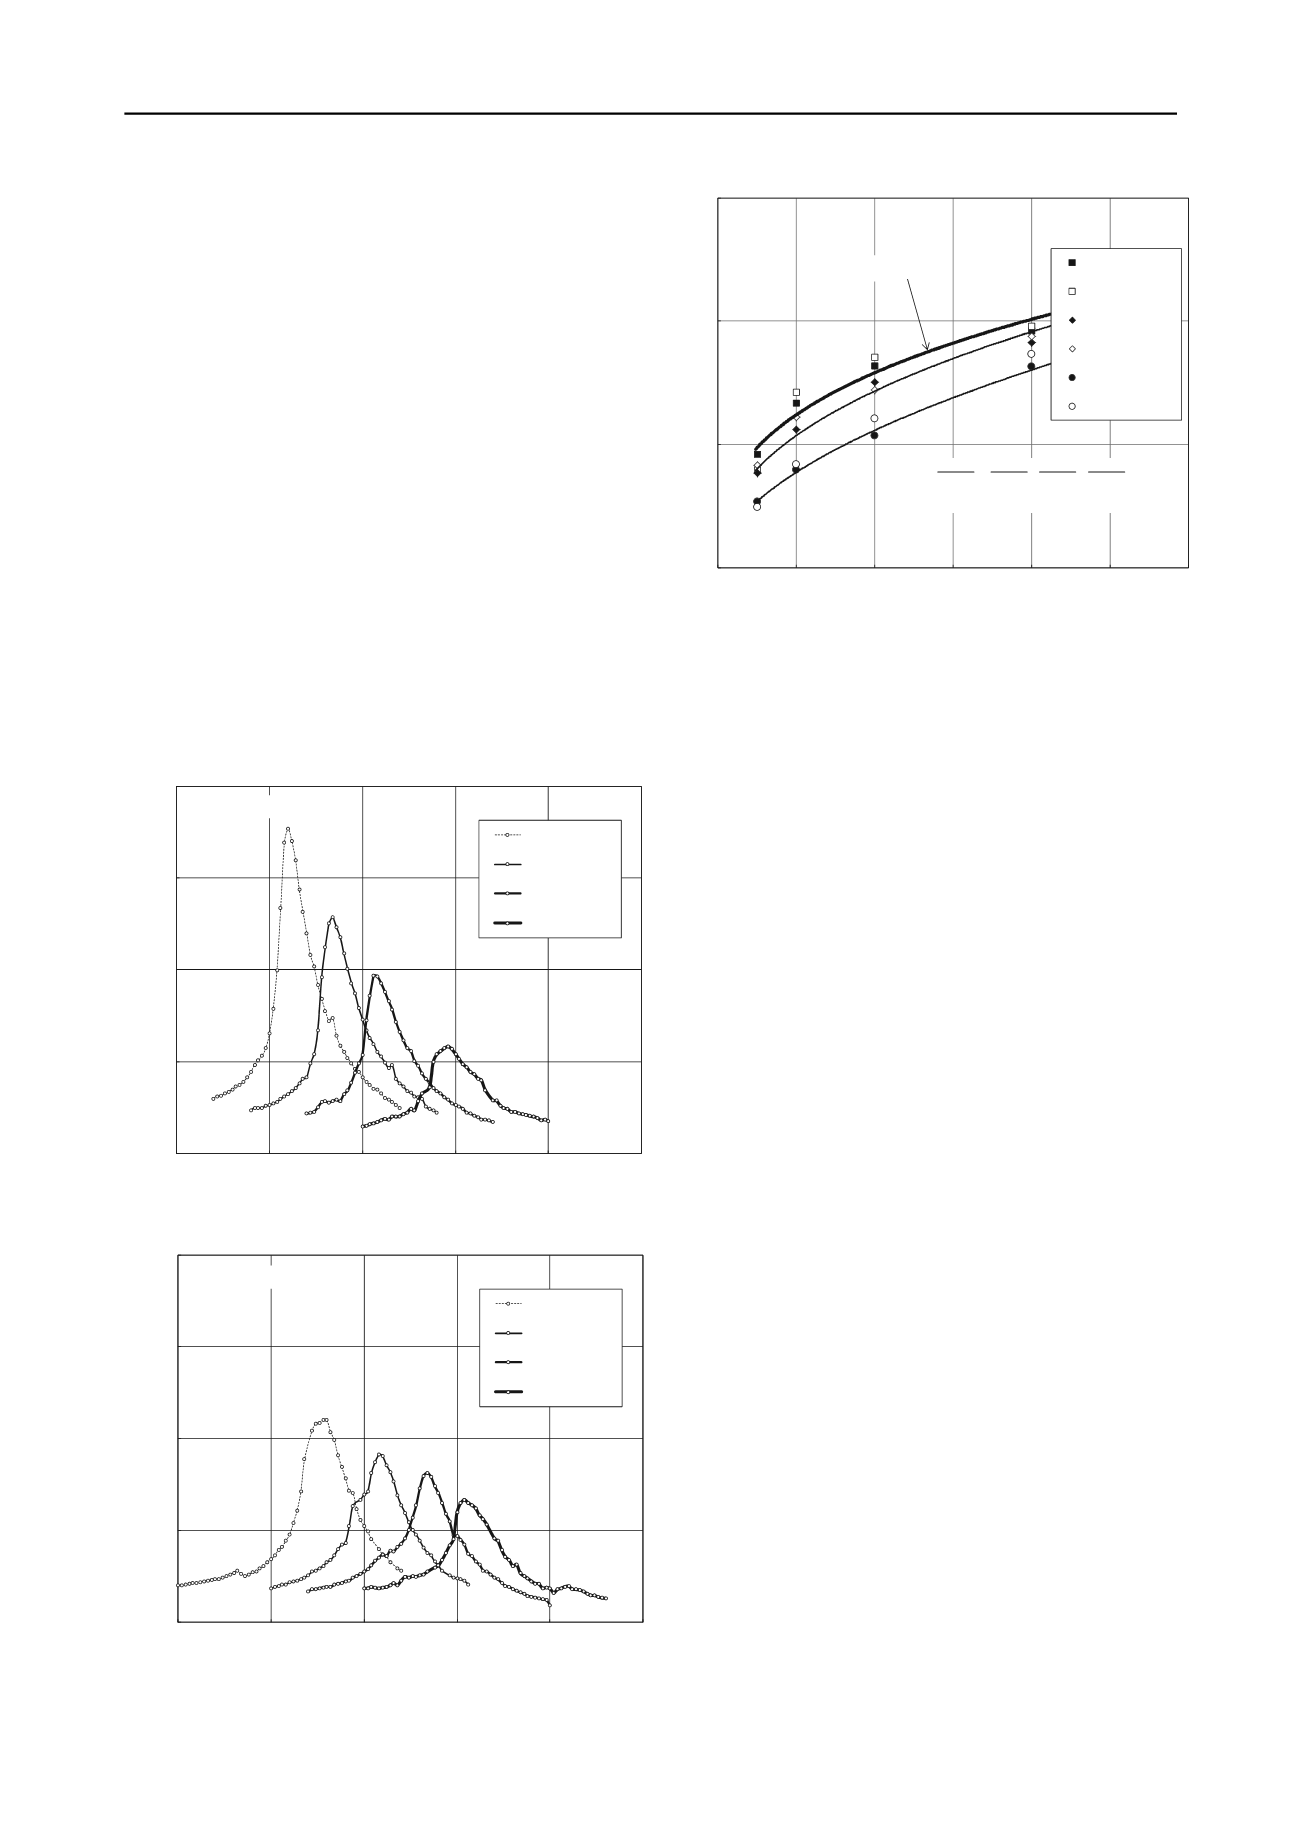
Figure 4 shows the variation of small-strain shear modulus G
max
(from both RC and BE tests) with net confining pressure, and
for different suction values. The trends confirm those shown in
Figure 3: suction is observed to have a significant influence on
soil stiffness, though not as pronounced as that of net confining
pressure. The BE technique yields G
max
values reasonably close
to those obtained via resonant column testing. Solid lines in
Figure 4 represent best-fit power regression functions of the
form, G
max
= A(p – u
a
)
B
. Constant A represents the value of
G
max
(MPa) at net confining pressure, (p – u
a
) = 1 kPa; while
constant B is the slope of the best-fit curve, which represents
how susceptible soil stiffness is to changes in net confinement
(p – u
a
).
0.0000
0.0005
0.0010
0.0015
0.0020
50
100
150
200
250
300
Shearstrain (%)
Frequency (Hz)
(p-ua) = 50 kPa
(p-ua) = 100 kPa
(p-ua) = 200 kPa
(p-ua) = 400 kPa
(a) s = 50 kPa
During bender element testing, the first arrival of shear-wave
was taken as the point of zero crossing after the first inflection
of the received signal, which corresponds to the first arrival of
the shear-wave based upon experimental and numerical studies
(Lee and Santamarina 2005). The travel distance is taken as the
tip-to-tip distance L between bender elements, hence the shear-
wave velocity is computed as V
s
= L/t, where t = travel time.
Knowing V
s
and the total mass (bulk) density of the specimen
, the small-strain shear modulus can be determined as G =
(V
s
)
2
.
0.0000
0.0005
0.0010
0.0015
0.0020
50
100
150
200
250
300
Shearstrain (%)
Frequency (Hz)
(p-ua) = 50 kPa
(p-ua) = 100 kPa
(p-ua) = 200 kPa
(p-ua) = 400 kPa
(b) s = 200 kPa
Figure 3. Frequency response curves from SM soil at different net
confinement and suction states: (a) s = 50 kPa; and (b) s = 200 kPa.
modulus response of SM
Figure 4. Dynamic shear
soil at different net
confinements and matric suction states.
Figure 5 shows the change in small-strain damping ratio D
min
(from RC tests) with matric suction, for different net confining
pressures. Damping is calculated from logarithmic decay curves
using: D
min
= (1/2
n)log
e
(Z
o
/Z
n
); where, Z
o
= peak amplitude of
the first free-vibration cycle, and Z
n
= peak amplitude of the nth
cycle. The trends confirm those in Figure 3, with lower damping
(higher stiffness) at higher matric suctions. In general, material
damping tends to be overestimated by the half-power bandwidth
method: D
min
= (1/2)(f
2
– f
1
)/f
r
; where f
r
= resonant frequency.
The main focus of the present work has been on small-strain
stiffness of compacted silty sand. The cyclic behavior of soils,
however, is nonlinear and hysteretic; consequently, the shear
modulus and material damping are heavily strain dependent.
Figure 6 shows the cyclic hysteretic stress-strain loops from two
SM soil samples subjected to a cyclic 10-pfs input torque (1 kN-
m) at matric suctions, s = 50 kPa (thinner trace) and s = 200 kPa
(thicker trace), respectively; both under the same net confining
pressure, (p – u
a
) = 200 kPa. Equivalent viscous damping could
also be evaluated from the area enclosed by the cyclic hysteretic
loops. Therefore, the loops further substantiate the trends shown
in Figure 5, with smaller areas enclosed by the cyclic hysteretic
loops, and lower shear strains induced by the same cyclic shear
stress, with increasing matric suction.
6 CONCLUDING REMARKS
Suction-controlled resonant column tests on compacted SM soil
shows that the newly implemented proximitor-based RC device
is suitable for testing soils under controlled suction states via
axis-translation technique. Test results underscore the influence
of soil suction over the frequency response curves, logarithmic
decay curves, cyclic hysteretic stress-strain loops, and the small-
strain stiffness properties of compacted SM soil. Lower material
damping (higher stiffness) is observed at higher suction states.
In general, material damping tends to be overestimated by the
half-power bandwidth method. Simultaneous suction-controlled
bender element tests produced G
max
values reasonably close to
those from resonant column tests.
The general trends observed in this research effort are
similar to those previously reported for a more limited range of
test variables (e.g., Kim et al. 2003, Sawangsuriya et al. 2009,
Ng et al. 2009). The time frame and scope of the present work
did not contemplate investigating the effects of initial void ratio,
stress history, hydraulic hysteresis, or the impact of net normal
stress and/or suction history on the normalized G/G
max
and
D/D
min
response of SM soil. The authors are currently embarked
on a more thorough research effort to gain further insight into
all these dynamic aspects of unsaturated soil behavior, including


