1130
Proceedings of the 18
th
International Conference on Soil Mechanics and Geotechnical Engineering, Paris 2013
The constitutive model proposed by Ohno et al. (2007) is used.
The effective stress for unsaturated soil is defined as;
net
s
p
σ σ
1
net
(1)
,
a
s
e
p p S
σ σ 1
s
(2)
,
1
r
rc
a
w e
rc
S S
s p p S
S
(3)
Here,
is the effective stress tensor,
is the net stress
tensor,
is the unit tensor,
σ
is total stress tensor,
σ
1
net
σ
s
is suction,
s
p
is su n stress,
a
ctio
p
is pore ir pressure,
w
-a
p
is pore-w ter
pressure,
r
S
is degree of saturation,
e
S
is effect e degree of
saturation, and
rc
S
is de ee of saturation at
a
iv
gr
s
yielding function is expressed as;
. The
, ,
ln
0
p
v
sat
p
q
f
MD
D
p
p
σ
p
v
(4)
exp (1 ) ln
s
n
e
S a
,
0
1
MD
e
(5)
1
3
1
: ,
: ,
: ,
3
2
3
p
q
p
σ 1
s s s σ 1 A σ A I 1 1
(6)
Here,
p
v
is plastic volumetric strain,
M
is
q p
in critical
state,
is dilatancy coefficient,
a
and
D
s
n
are shape
parameters expressing increase in yield stress due to
desaturation, and
and
are compression and expansion
index, respectively. The yield surface expressed by Eq. (4) is
illustrated in Figure 2. The following elasto-plastic constitutive
model is obtained from Eq.(4) and the associated flow rule.
:
e
S
σ D ε C
D
(7)
Here,
is elasto-plastic stiffness matrix,
ε
is strain tensor,
is the tensor expressing change in stiffness due to desaturation.
C
2.2
Governing equations of pore-water and pore-air
The governing equations for pore-water and pore-air are
expressed as follows in the track of Borja (2004):
Darcy’s law (water)
(8)
grad
h
w
w
v k
Darcy’s law (air)
grad
a
p
a
a
v k
(9)
Continuity equation (water)
div 0
r
r v
nS S
w
v
(10)
Continuity equation (air)
0
1
1
di
a
r v
r
r
a
p
S
nS n S
p p
a
v
v 0
(11)
Here,
and
are flux of pore-water and pore-air,
w
k
and
a
are permeability of water and air, is total head, and
0
w
v
a
v
k
h
p
is
atmospheric pressure. The formula for the soil/water/air coupled
initial and boundary value problems can be obtained by
spatially and temporally discretizing Eqs. (7) to (11).
②
③
⑤
①
④
②
③
⑤
①
④
2cm
1cm
Loadi ng
0.3cm
0.3cm
Loading
1min
Time
Load
1600(kPa)
800(kPa)
400(kPa)
0
10min
60min
Unloading
1min
0
200
400
600
800
0
0.2
0.4
0.6
0.8
1
Suction (kPa)
Degree of saturation
Drying:
A
=-34.7,
B
=5.9
Wetting:
A
=-24.0,
B
=4.6
S
rc
=0.15
S
rf
=1.00
S
r
=
S
rf
-
S
rc
+
S
rc
1+exp(
A
+
B
ln
s
)
Logistic curve Eq.
(a)
Static compaction
(b)
Shearing
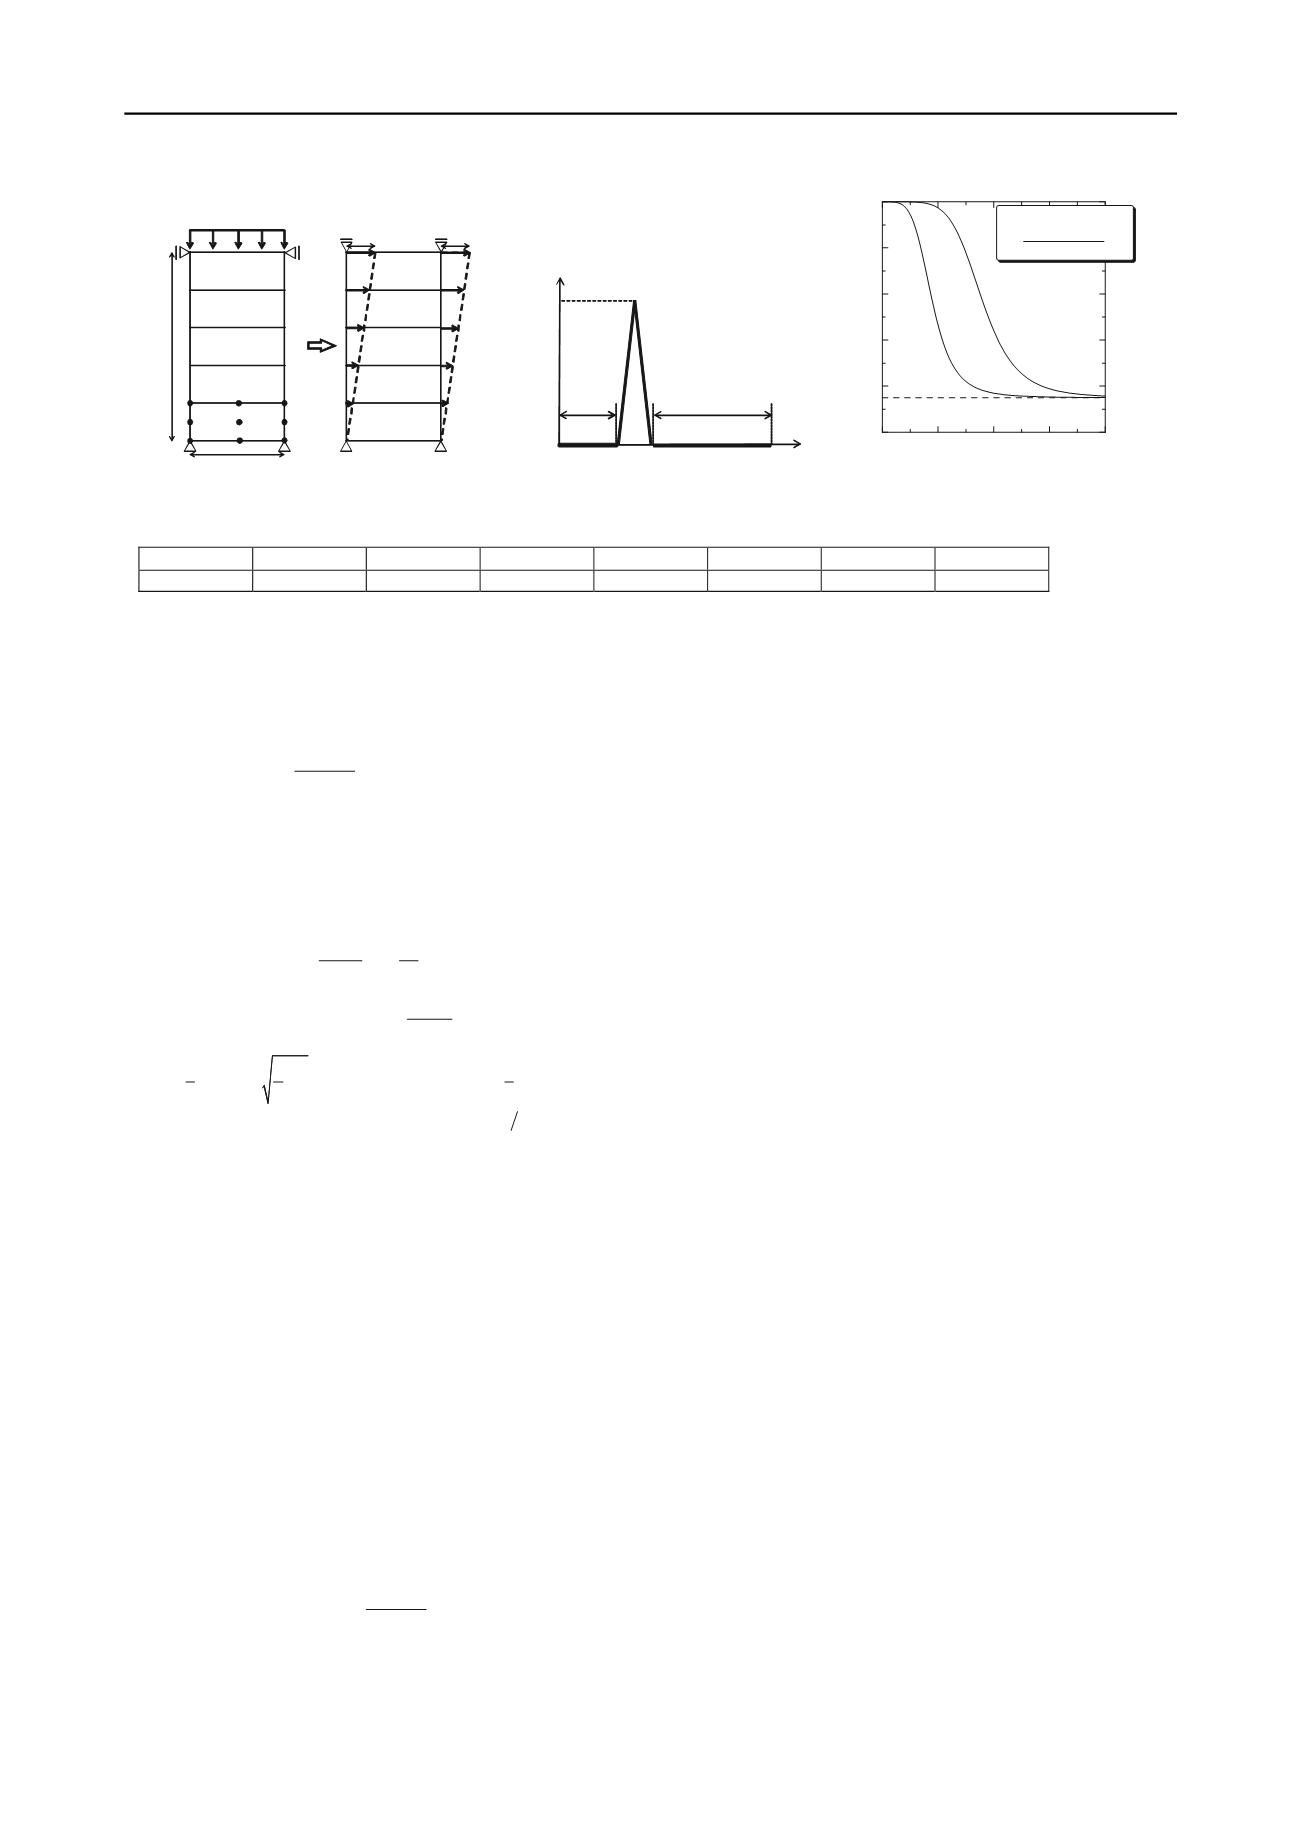
Figure 3. Analytical mesh and conditions
Figure 4. Loading condition
Figure 5. Soil water retention characteristics
Table 1. Material parameters for simulations
w
k
(m/day)
M
3 ANALYTICAL CONDITIONS
The objective of compaction is compressing soil mass with
draining air. In this study, compaction is defined as compression
and rebound of unsaturated soil under drained air and undrained
water conditions, and the static compaction test is simulated
with soil/water air coupled F. E. analysis. Figure 3(a) shows
analytical mesh. One-dimensional geometric condition is
assumed, and undrained water for all boundaries and drained air
for upper boundary conditions are provided. Figure 4 shows the
loading condition. Table 1 summarizes the material parameters
for simulations and Figure 5 shows soil water retention
characteristic curves (SWRCC). The SWRCC model proposed
by Kawai et al. (2007) is used here. A void ratio of 0.85 and
water content of 10 to 28% are provided for initial conditions.
Initial suction is set according to the primary wetting curve.
Moreover, shear deformation shown as Figure 3(b) is applied to
the specimen obtained from static compaction simulations to
examine shear strength of compacted soil (Simple shear
simulation).
4 SIMULATION RESULTS AND DISCUSSION
4.1
Static compaction simulation
Figure 6 shows changes in the void ratio of element 3 under
800kPa compaction load. The yield stress, the folding point of
compression line, is found to depend on water content. Since
pore-water is not drained during compaction, the degree of
saturation increases with compression due to loading, and the
degree of saturation decreases with rebound due to unloading
(Figure 7). This behavior is more remarkable on the specimen
with higher water content. Figure 8 shows the relationship
between suction and the degree of saturation during compaction.
According to SWRCC, the increase of saturation due to loading
means the wetting process and suction decreases. On the other
hand, the decrease of saturation due to unloading creates
increase in suction in accordance with the drying process.
Consequently, suction changes are more remarkable on the
specimen with higher moisture because it shows a relatively
bigger change in the degree of saturation (Figure 9). Suction
after compaction is greater than before compaction for all
specimens. This means that compaction contributes to increase
in stiffness of the soil. The specimen with lower moisture shows
higher suction after compaction. The changes in pore-air and
pore-water pressure are shown in Figures 10 and 11 respectively.
a
s
n
a
k
(m/day)
m
0.107
0.011
0.01
1.344
30
1.0
1.00
0.8
m
: Mualem’s modulus (1976)


