1123
Technical Committee 106 /
Comité technique 106
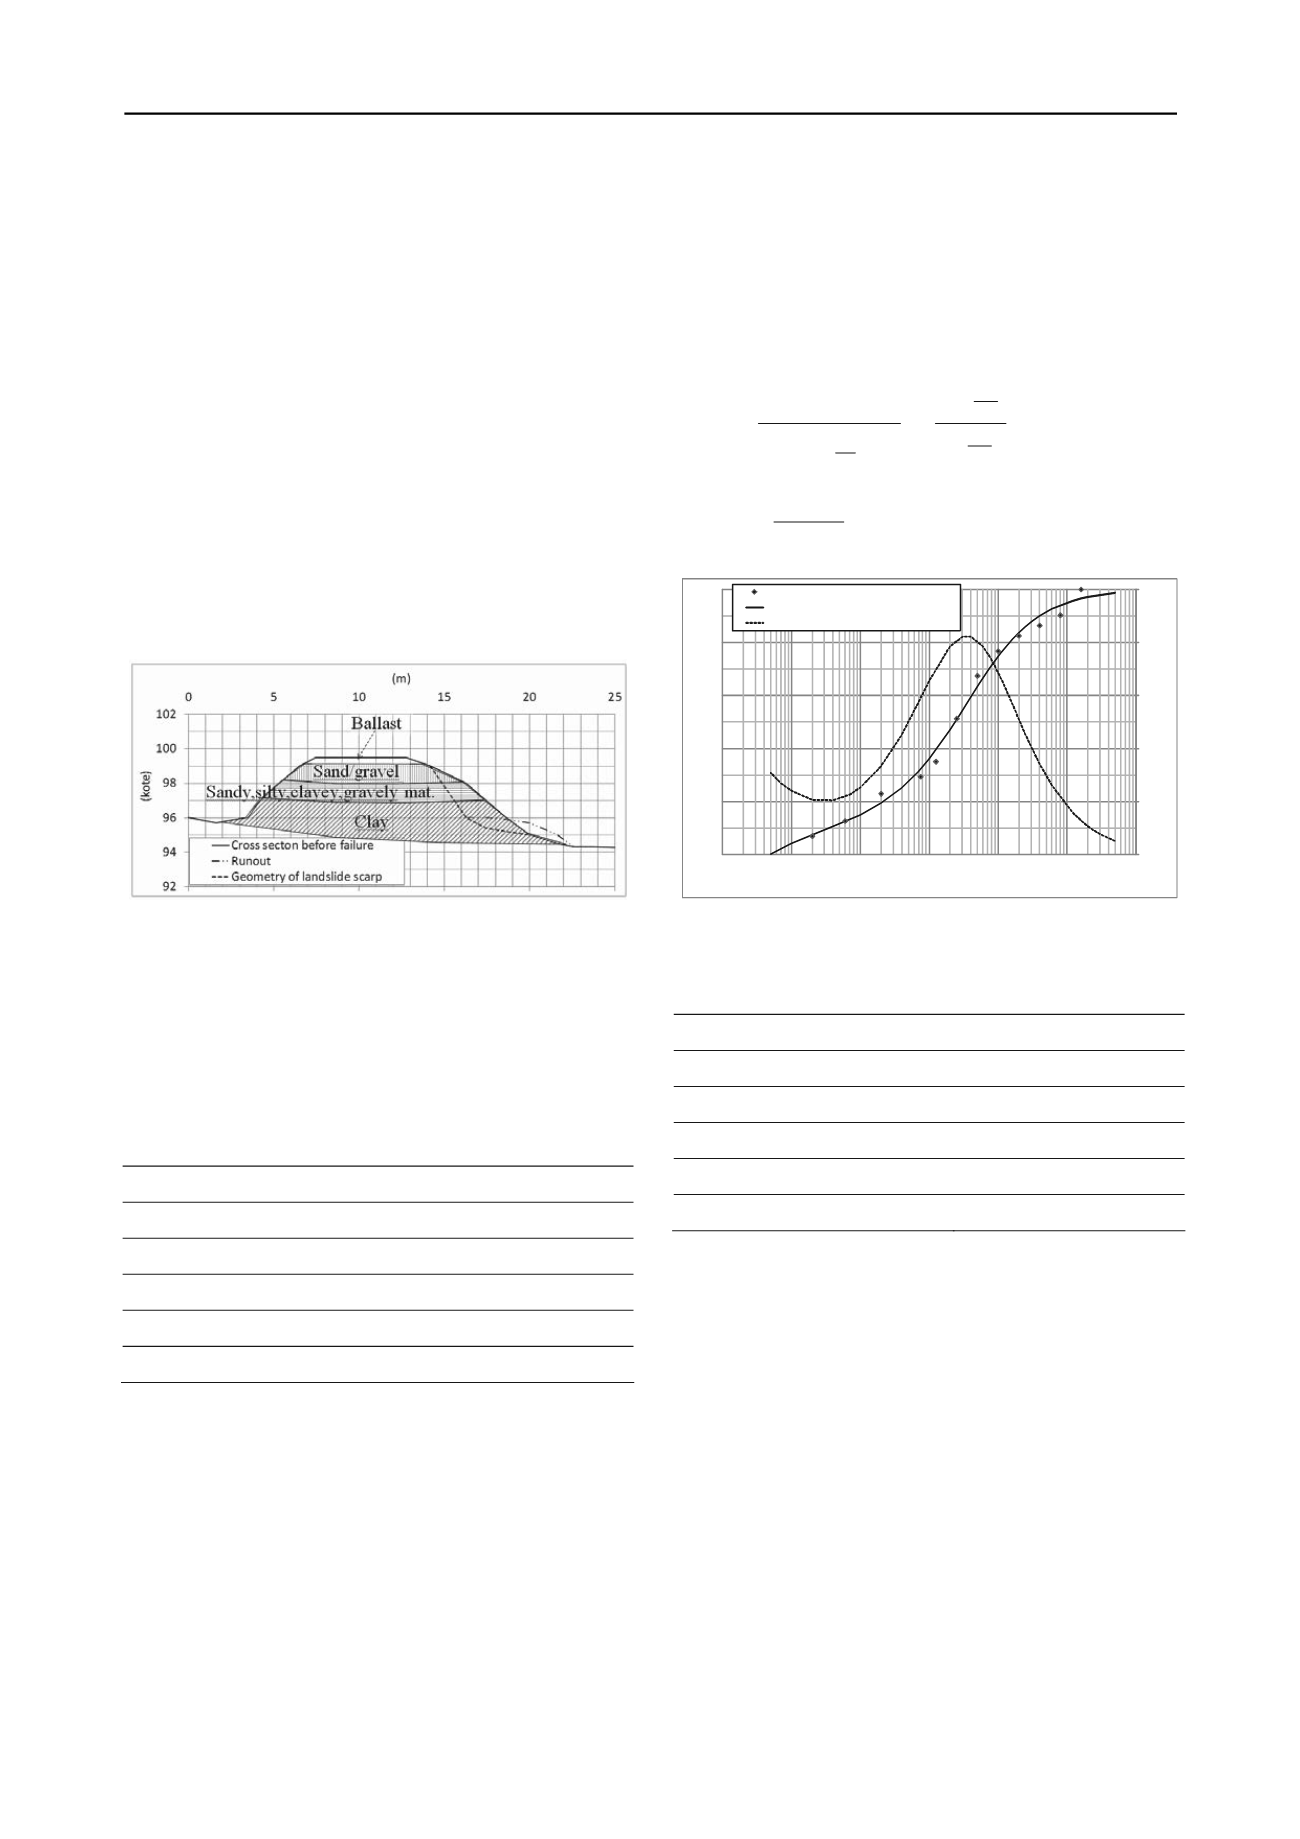
3 CASE: TOMTER EMBANKMENT FAILURE
A slope failure at a railway embankment at Tomter occurred on
23
rd
December 2011. The line was not physically cut off, but
train traffic was stopped until inspection by geotechnicians from
NGI was made the following day. A cross section is shown in
Fig. 2. Field survey was somewhat hindered by low
temperatures and a thin frozen crust that had developed through
the preceding night. It was found that the embankment consisted
of a bottom layer of clay on top of the natural terrain (marine
clay), followed by a layer with high sand and silt content.
Above this layer there was a 1 m thick layer of sand and gravel,
added in a general uplift of the track around 1950-60, and at the
top crushed rock ballast. In spite of the elevation above the
surrounding terrain, the sandy/silty layer was observed to be
very moist, and appeared almost liquefied. The water content
w
of a bag sample was measured to 17.5 %. In situ saturation rate
of the sandy/silty layer may not be determined from a bag
sample (in situ density is unknown and water is lost during
sampling), but this indicates that the sandy/silty layer may in
fact have been close to full saturation prior to the slope failure.
Figure 2
. Cross section of failed embankment at Tomter, Østfold
county railway line. Geometry of slope failure 23
rd
December 2011 is
indicated. Natural soil below embankment is marine clay.
Results from grain size distribution (GSD) analysis of the
sample are summarized in Table 1 and Fig. 3. The moist layer
described in field as a sandy/silty layer is characterized as
sandy, silty, gravely and clayey material, according to
terminology and grain size limits defined in Norwegian
Geotechnical Association (1982). The soil is well graded.
Table 1. Results from grain size distribution analysis of bag sample
Parameter
Value
Gradation number
C
u
= D
60
/D
10
(-)101.1
101.1
Clay content D < 0.002 mm (%)
6.9
Silt content 0.002 < D < 0.006 mm (%)
21.4
Sand content 0.006 mm < D < 2 mm (%)
54.2
Gravel 2 mm < D < 60 mm (%)
17.5
An empirical curve for the grain GSD is also shown in Fig.
3. The curve was fitted by using a five parameter equation for
unimodal GSD (Fredlund et al. 2000), see Eq. 1. In Eq. 1, the
percentage of particles
Pp
passing a certain sieve size is given
as a function of the particle diameter
D
(mm). The parameter
a
gr
is related to the breaking point of the curve,
n
gr
is related to the
steep part of the curve,
m
gr
is related to the shape of the curve in
the fines region,
d
r
is related to the fines content and
d
m
is the
minimum allowable particle size. The value of
d
m
was chosen
based on the grain size data. The other parameters are result of
statistical optimization. For the resulting curve the
R
2
value is
99.15%. Final parameters are shown in Table 2.
Also shown in Fig. 3 is the logarithmic PDF (probability
density function) for the sample, which is the result of
differentiating the GSD-curve. The PDF will correctly represent
the most frequent particle size when first taking the logarithm of
the particle size, see Eq. 2 (Fredlund et al. 2000), in which
P
l
(
D
)
is the logarithmic PDF. For the analyzed sample the most
frequent particle sizes are found in the sandy fraction, with a
peak at 0.3-0.4 mm. This corresponds with the laboratory
description of the soil, where the first adjective (“sandy”)
nominates the largest mass fraction.
7
1
1 ln
1
)1 exp(
ln
1
) (
m
rgr
rgr
m n
gr
d
d
D
d
D
a
DPp
gr
gr
(1)
(2)
0
10
20
30
40
50
0
20
40
60
80
100
0,0001
0,001
0,01
0,1
1
10
100
Percentage passeed (%
)
(mm)
Lab.data Tomter A ‐SILTY,SANDY,CLAYEYMAT.
Best fitcurve (Fredlundetal.2000)
PDF (logarithmic)
Probability (%
)
Figure 3. Results from laboratory GSD analysis, empirical GSD
function and logarithmic PDF (Fredlund et al. 2000).
Table 2. Parameters for empirical GSD curve (Fredlund et al. 2000).
Parameter
Sample Tomter A
a
gr
(-)
0.6133
n
gr
(-)
0.8357
m
gr
(-)
1.4909
d
rgr
(-)
0.7612
d
m
(mm)
0.0005
4 ANALYSIS OF EMBANKMENT FAILURE
The railway embankment that collapsed at Tomter on 23
rd
December 2011 is used to illustrate the geotechnical behaviour
of old railway embankments. The seepage module Seep/w of
the geotechnical software Geo-Studio 2007 (Geo-Slope
International 2007) was used for flow analysis of the
embankment. The routine in Seep/w for predicting the water
retention curve from GSD data (Aubertin et al. 2003) was used
for layer B. For layers A and C, ad hoc curves are used to
represent typical properties for these layers and are not
discussed further here. Hydraulic conductivity functions and
saturated permeability for layers A, B and C are shown in Fig. 3
and Table 3, respectively. The top layer D (crushed rock ballast)
is assumed very permeable and completely drained, and is
excluded from the seepage analysis.
The hydraulic conductivity curves show the well-known
effect that less permeable clay (when saturated) is more
permeable than coarse-grained soils for high matric suction.
)
)
d
P
p
log(
(
D
dP
D
l


