1114
Proceedings of the 18
th
International Conference on Soil Mechanics and Geotechnical Engineering, Paris 2013
13.8% of water content and relative compaction of 95% of
maximum dry density from Standard Proctor.
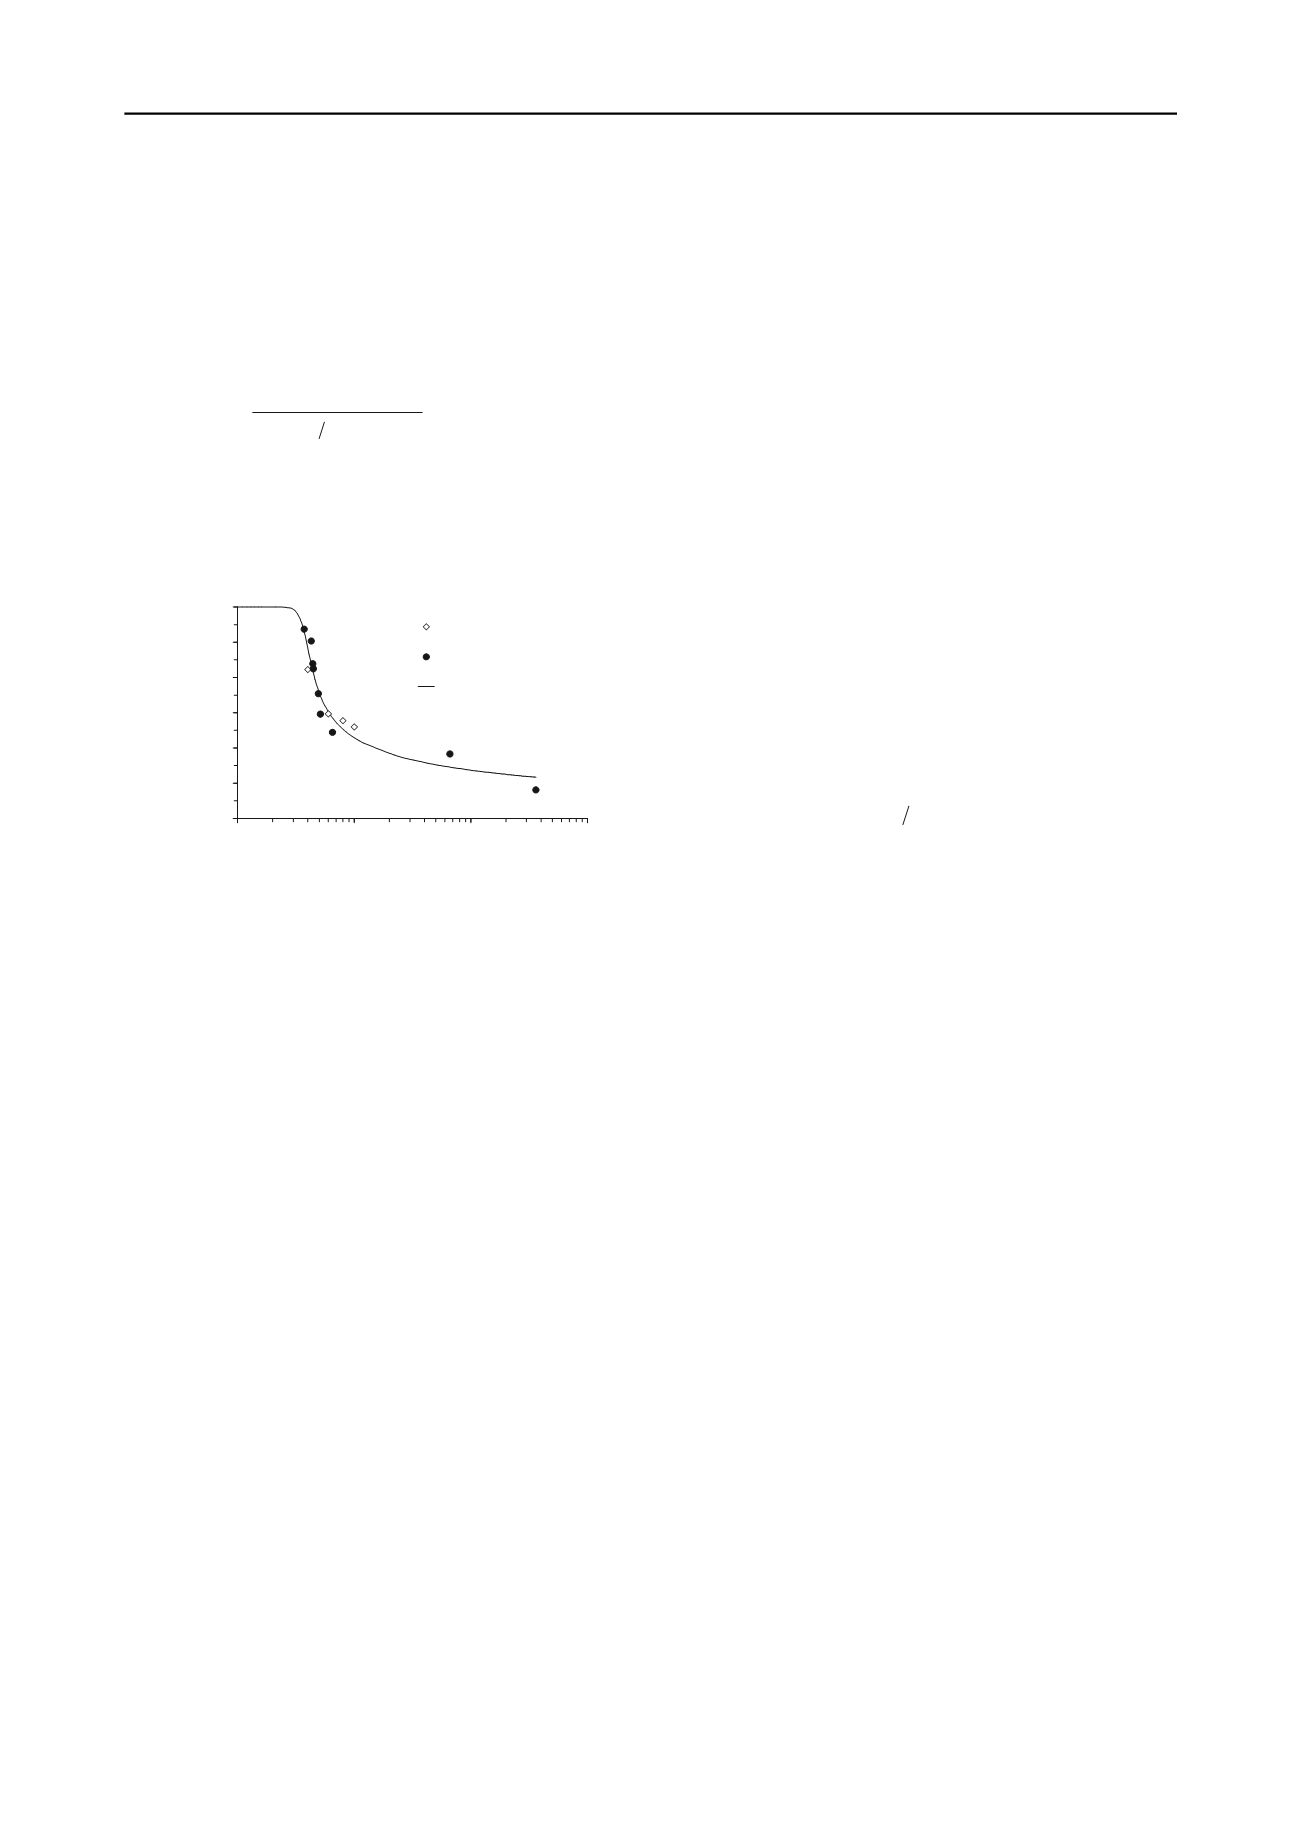
The soil-water retention curve for such compaction condition
is shown in Figure 1. Plate funnel and filter paper techniques
were used to obtain the experimental data on drainage path. The
model proposed by Fredlund and Xing (1994) was fitted to
experimental data, providing Equation 1 to represent the soil-
water retention curve.
320 0 72 12
623
633 100
633
.
.
.
.
eln
.
Sr
(1)
where
Sr
is the saturation degree and
ψ
is the matric suction.
This is a typical curve of sandy soil, with low air-entry value
and large desaturation for suction variation between 4 and 10
kPa. The relative low dry density after compaction also
contributes to these features.
40
50
60
70
80
90
100
1
10
100
1000
Matric suction (kPa)
Saturation degree (%)
Porous plate funnel
Filter paper
Fredlund & Xing (1994)
Figure 1. Soil-water retention curve.
2 TESTING PROCEDURES
2.1
Shear strength
In this experimental program, triaxial compression tests were
performed to investigate the shear strength of the soil. The tests
comprised shearing five saturated specimens under
consolidated-drained (CD) condition. Additionally, three
constant water content (CW) triaxial tests were carried out on
unsaturated specimens, which were previously led to some
known suction. The multistage technique (Ho and Fredlund
1982) was chosen for these latter experiments in order to reduce
their duration, as suction equilibrium is a known time
consuming process.
In the CD tests, the specimens were saturated by
backpressure until the parameter B was at least 0.95. Next, the
soil was isotropically consolidated and then sheared at a strain
rate of 10
-3
%/s, which is lower than the calculated from the
consolidation stage. The effective confining pressures were of
50, 100, 150, 300 and 500 kPa.
For the CW tests, the specimens went through a pre-testing
procedure, which consisted of reducing the compaction-induced
suction to zero by capillary rising, and then imposing target
suction via axis translation technique in auxiliary chambers. In
the CW tests, the soil was consolidated maintaining constant
suction (
u
a
-
u
w
), where
u
a
and
u
w
are respectively pore-air and
pore-water pressures, and increasing the net confining pressure
(
σ
3
-
u
a
) at each stage. The net confining pressures were of 50,
150, 300 and 500 kPa, and target initial suctions were of 15, 40
and 100 kPa. At the end of consolidation, pore-water pressure
was allowed to equilibrate by closing the water drainage valve.
Then, suction at the beginning of shearing was computed from
the difference between pore-air and water pressures.
Maintaining pore-water undrained and pore-air pressure
controlled, shearing was carried out at a strain rate of 6.7 x
10
-5
%/s until axial strains of about 5%, where stress
approximately leveled off. In the fourth stage, the specimen was
allowed to shear up to larger strains. The strain rate of CW tests
was selected based on data of triaxial compression tests on
different soils types gathered by Fredlund and Rahardjo (1993)
and also on tests presented by Georgetti and Vilar (2010) in the
same soil.
2.2
Small-strain shear modulus
The experimental program also comprised tests to measure
saturated and unsaturated soil shear modulus.
Saturation and suction imposition prior to testing were
carried out following the procedure described in 3.1. During the
tests, the specimens were consolidated in triaxial cells with
bender elements embedded in the top caps and base pedestals.
Different levels of isotropic stress were applied keeping
saturation or constant suction. This paper focus on part of these
experiments in which the soil were confined in steps from 10 to
500 kPa of isotropic effective stress or net stress, for the
saturated and unsaturated specimens, respectively. At the end of
each confining step, shear waves were transmitted through the
soil by the bender elements. Input signals were single sine
pulses with a voltage of 14 V and frequencies that ranged from
1 to 50 kHz. Such wide range of frequencies allowed selecting
the pulses with minor signal interferences of near-field effects.
The small-strain or maximum shear modulus of the soil was
then calculated by Equation 2.
2
s
o
V.
G
with
tL V
s
(2)
where
ρ
is the density of the soil;
V
s
is the shear wave
velocity;
L
is the wave path length, taken as the distance
between the tips of source and receiver bender elements; and
t
is
the shear wave travel time.
The shear wave travel time was estimated as the first arrival
of the received signal, more specifically, as the time interval
between the transmitted and the first major deflection of the
received signal. Besides being straightforward, the first arrival
has been recommended as a reliable method for calculating the
shear velocity (see Chan 2010 and Clayton 2011, for instance).
Four tests were carried out following the above procedure,
with suction ranging from zero (saturated soil) to 100 kPa.
3 RESULTS AND DISCUSSIONS
3.1
Shear strength
From the triaxial compression tests with both saturated and
unsaturated soil, the maximum deviator stresses were used to
obtain shear strength parameters. It was possible to fit two shear
strength envelopes: one, up to approximately 200 kPa of stress
and other considering the stresses larger than 200 kPa. The
corresponding shear strength parameters were effective
cohesion (
c’
) = 10 kPa and effective friction angle (
’
) = 31°,
and
c’
= 0 and
’
= 33
o
, respectively.
Regarding constant water content triaxial compression tests
in the unsaturated compacted soil, typical stress-strain and
suction-strain curves are shown in Figures 2 and 3, respectively.
Figure 2 shows that shear strength increased at each stage and
small elastic strains were recovered when the specimen was
axially unloaded to beginning the next stage of testing. The
visual inspection of specimens and the format of the stress-
strain curves indicate that no distinct failure plane was formed
and therefore is reasonable to use the multistage test to evaluate
the shear strength of this soil. Figure 3 reinforces a tendency of
suction variation that was already observed by Georgetti and
Vilar (2010): after an initial decrease, suction tended to increase
for the lower net confining stresses and remained approximately
constant for the larger confining stresses. Rahardjo et al. (2004)


