1107
Technical Committee 106 /
Comité technique 106
magnitude of damage force in a specific height decreases in
comparison with the previous time.
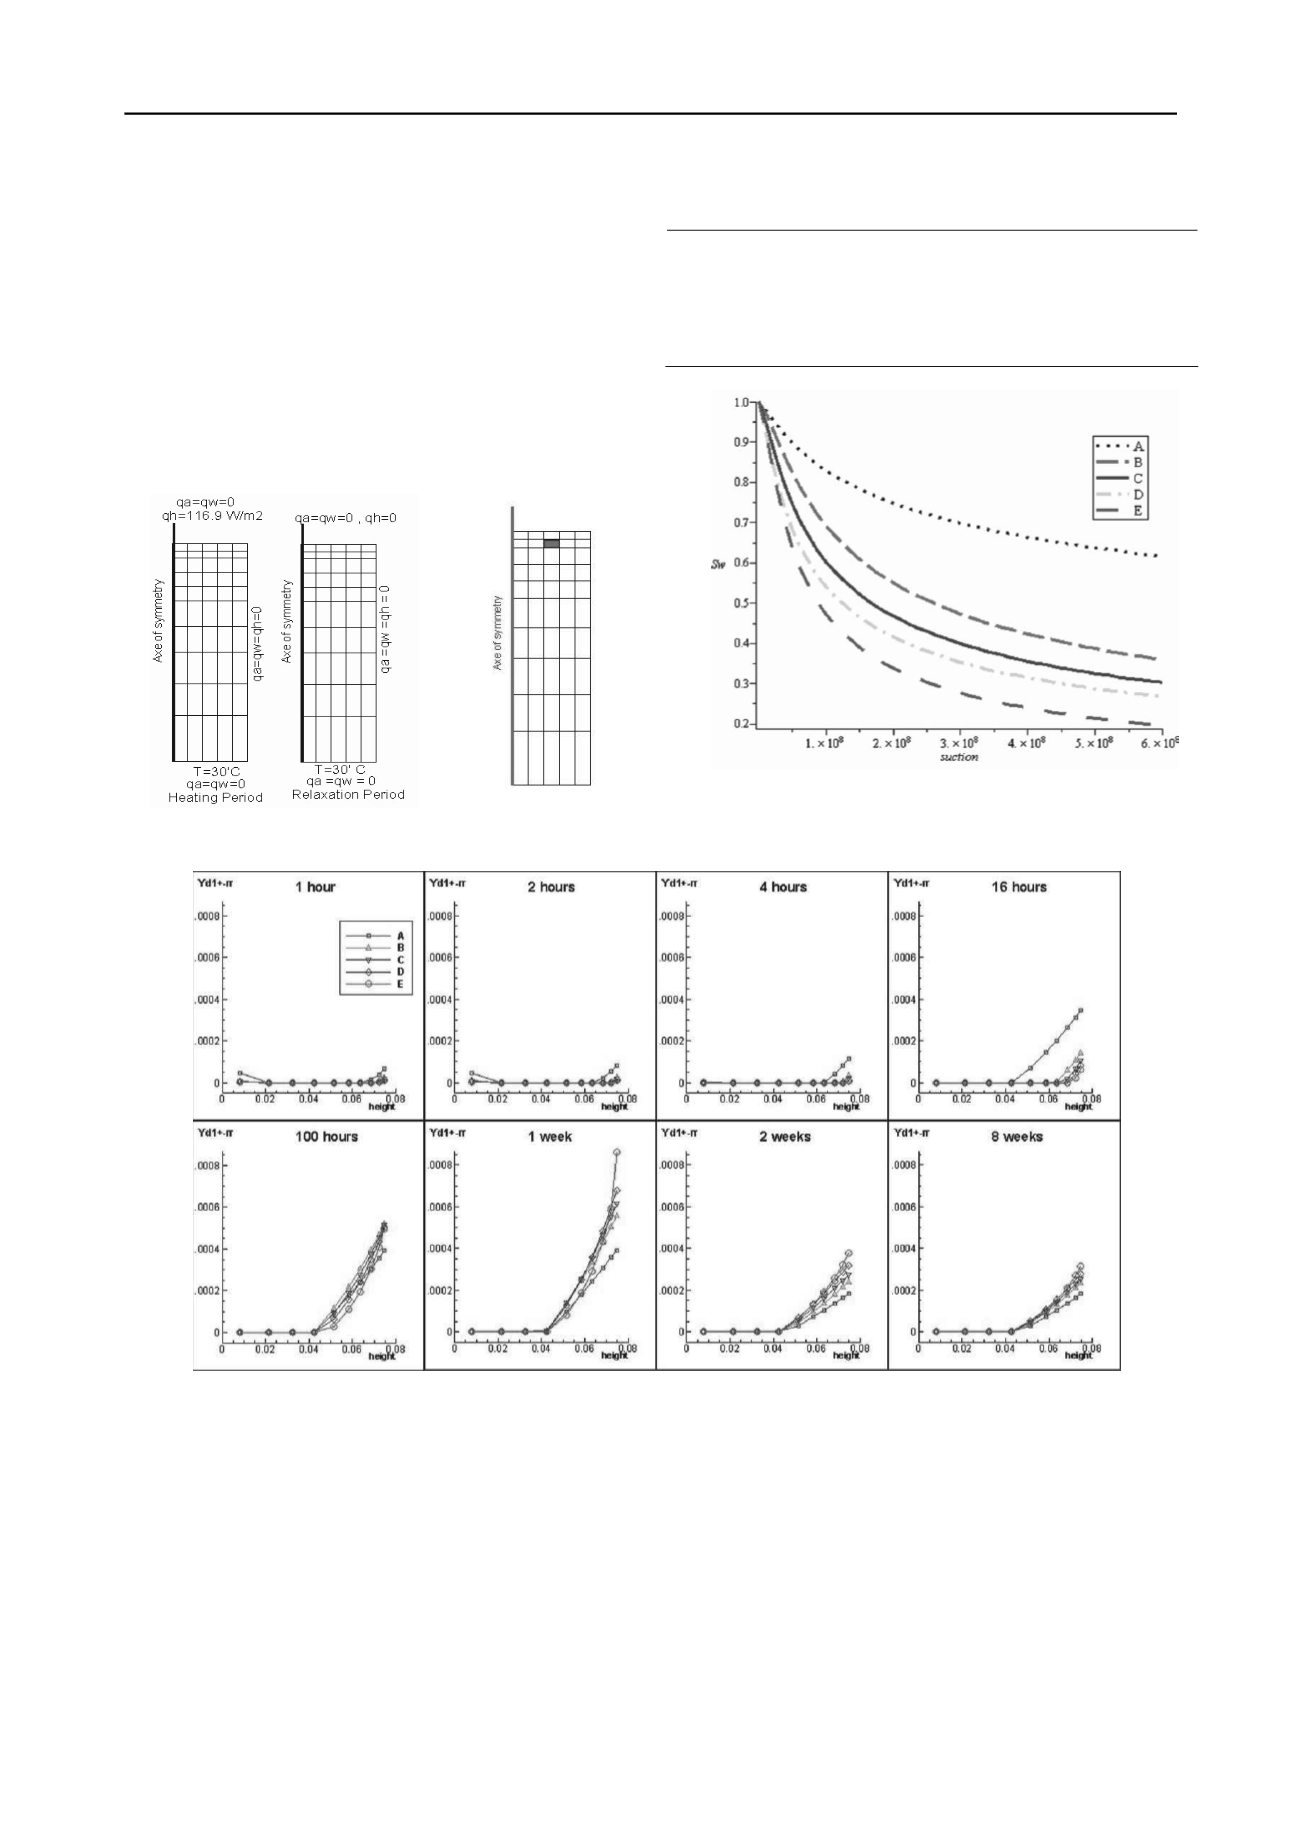
Table 1. Parameters of the five Van Genuchten water retention
curves
This is because the damage is affected by different parameters:
In one side, heating changes stress distribution which is the
generator of damage; in the other hand, there is extraction of
solid skeleton at the zones near the thermal source, and there is
contraction of it at the further zones, which leads closure of
openings and reducing of generated stresses. Further, the
suction increase is equivalent to a compressive loading, since it
diminishes damage stresses. Therefore, we can say that at first,
factors generating damage forces induce cracks; afterward, in
the following times damage force reduction factors beget to
drop damage force which has been produced at former times.
Graph α(VG) n (VG)
A 1.87E+08 1.2
B 1.87E+08 1.429
C 2.87E+08 1.429
D 3.87E+08 1.429
E 3.87E+08 1.5
Figure 1. Bentonite heating test. Boundary
conditions.
Figure 2. Element
number 22
Figure 3. Five used Van Genuchten water retention curves
Figure 4. Evaluation of damage in all specimens at the whole testing time
Though the heat source is shut down at the time of one week,
the magnitude of damage at the height of about 0.0585 to
0.0665 meters above the bottom of samples is increased at
second week in comparison with one week. The increase of
damage in mentioned part of the sample even after shutting
down the heat source can be discuss as below: It explained
before that in the loading phase, there is extraction of solid
skeleton at the zones near the thermal source, and there is
contraction of it at the further zones. After removing thermal
loading, the distribution of temperature in all elements of upper
part of sample has got relatively uniform; therefore, the zones
with extraction of skeleton get smaller, also the zones with
contraction of skeleton extract. The extraction of this part
causes the pores get bigger and so that the crack opening rises in
this part.
Figure 5, illustrates the damage parameter versus
temperature for an element which is located near the heat source
(element number 22 which is shown in Figure 2). The samples
can be divided into two upside part and downside parts, and the
trends of drying or wetting are investigated. With this strategy,
during the heating period the upside part of the sample loses its
water while the downside part of the sample gets wetter. At the
top part of the samples, using the water retention curves shown
in Figure 3, it can be concluded that specimen E has the highest
amount of moisture and samples D, C, B, A, respectively get
drier. Since the chosen element is in up part of the sample,
according the above arguments, the specimen A is the drier


