1141
Technical Committee 106 /
Comité technique 106
Due to large volume deformations of such soils the
measurement of shrinkage limit is advisable. Shrinkage limit
w
s
is marked by horizontal line in Figure 8.
From potentiometer WP4-T measurements nothing is known
about the behaviour at low suction range, as it could be
observed that the shape of SWRC changes at low suctions. This
behaviour could be measured by HYPROP device.
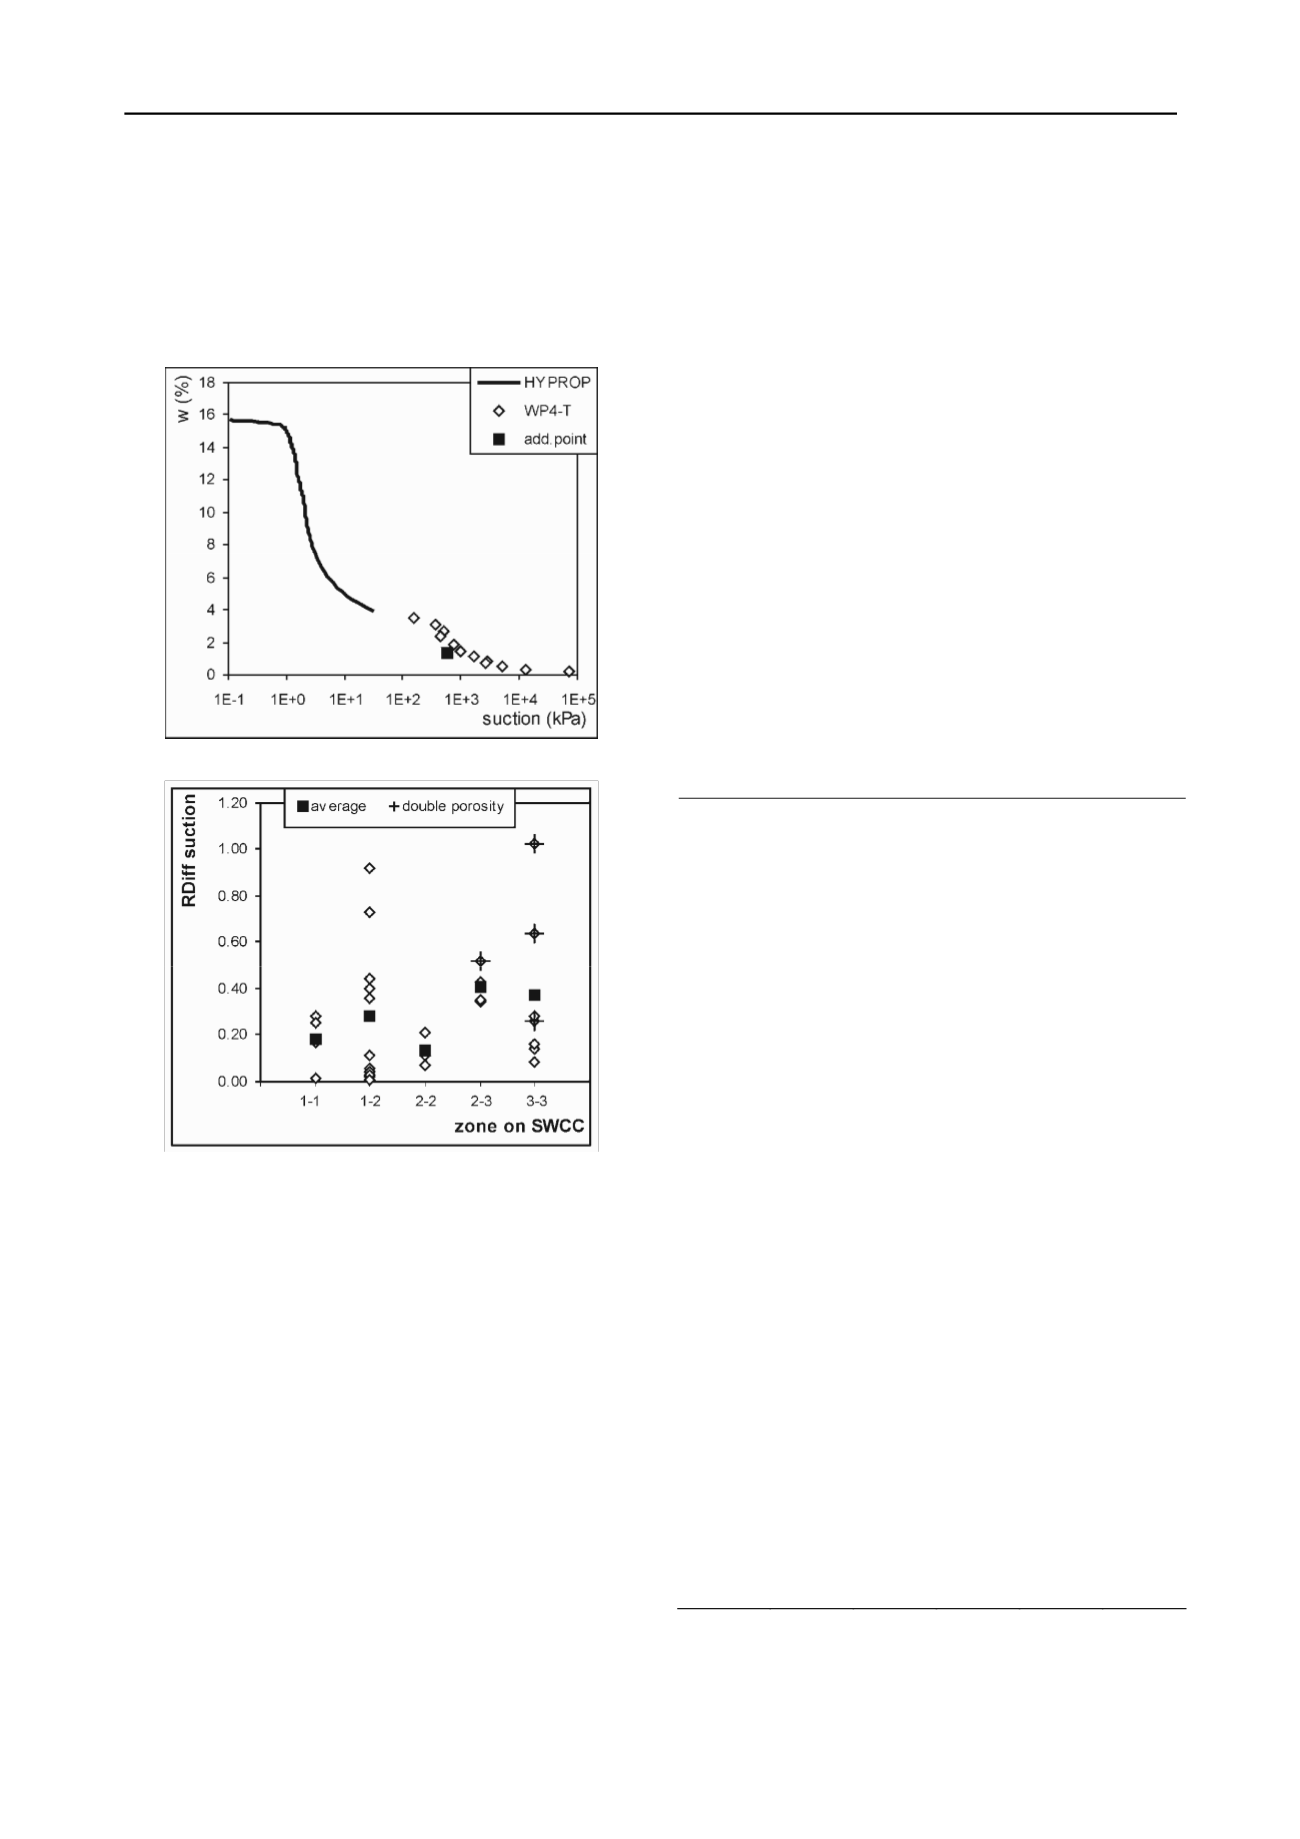
Figure 9. The observed double porosity of some silty sands.
Figure 10. A relative difference between WP4-T device and HYPROP
device measurements.
From the HYPROP device measurements an average suction at
the tension collapse of the upper tensiometer was determined
for all samples. This suction value was compared with the
estimated suction from the potentiometer WP4-T measurements
at the same water content. A relative difference between both
methods was calculated and they were compared to the zone on
SWRC (Table 2, Figure 10). An average relative difference is
approximately 30%, and is higher if HYPROP measurements in
stage 1 are in different zone on SWRC than tension collapse.
The highest observed relative difference was 102% and is
shown in Figure 10. The observed relative differences of up to
100% are relatively small and higher differences are frequently
observed with the same measurement device (Agus and Schanz,
2007, Cardoso et al., 2007). High relative differences in case of
zone 3 result from double porosity nature of the tested soil
(Table 2, Figures 9 and 10).
The water contents at the same suctions were also compared.
The average relative difference was 15% and the highest
relative difference was 60%, but it is important to note that the
suction is usually drawn in a logarithmic scale and the water
content is presented in a normal scale.
6
CONCLUSION
The main purpose of the paper was to demonstrate that the two
simple and cheap methods for measuring soil suction in the
laboratory are useful when the extensions of their measuring
ranges are made and that the comparisons between both
measurement methods were found to be good.
However, both methods have their drawbacks. If
potentiometer WP4-T is used, the osmotic suction can influence
the results. In this case the osmotic suction should be measured.
When the HYPROP device is used, the AEV of the tested
soil is important. When the AEV of the soil is higher than the
AEV of the ceramic cap, the described assumptions are not
necessarily valid. Therefore, good engineering judgment is still
needed.
The proposed extensions give good and reliable data.
Differences between both methods are small and are in the
range of expected differences even for measurements with the
same devices.
An extension of the working range of HYPROP device gives
less accurate predictions if the zone on SWRC is changed
during stage 2 or if the soil has double porosity.
Table 2. Estimated suction and water content at tension collapse and the
elative error to the measurements with WP4-T.
r
classification
zone
(from-to)
suction
(kPa)
w
(%)
RDiff
suction
(%)
RDiff
w
(%)
SW-SP
3-3
643
1.6
16
10
SW-SP
3-3
587
15.7
28
11
SW-SP
2-3
673
15.5
34
14
SP-SM
3-3
614
1.8
14
8
SP-SM 1-2
547
4.6
44
24
SP-SM*
3-3
573
2.5
64
44
SP-SM*
3-3
587
1.3
102
61
SP-SM
3-3
587
2.3
9
6
SP-SM*
2-3
700
4.8
52
40
SM
2-3
673
4.7
43
25
SM
2-2
629
2.3
11
6
SM*
3-3
600
3.9
26
14
SM
2-2
658
4.0
7
4
SM
1-2
868
8.5
3
1
SM
2-3
600
1.9
35
20
SM
1-2
810
4.1
4
2
SC-CH
2-2
692
10.3
21
8
SC-CH
1-2
468
15.3
40
18
SC-CH 1-2
708
16.1
1
0
SC-CH
1-2
776
13.4
73
27
SC-CH
1-2
631
17.4
36
13
CL
1-2
832
15.2
2
1
CL
1-2
676
12.6
92
27
CL
1-2
851
10.9
6
3
CL
1-2
750
19.0
11
5
CH
1-1
848
31.6
26
34
CH
1-1
646
32.1
28
13
CH
1-1
810
22.4
17
7
CH
1-1
631
30.9
1
0
RDiff – relative difference, bold – SWRC presented in Figure 8, italic -
SWRC presented in Figure 9, * - observed double porosity.


