1168
Proceedings of the 18
th
International Conference on Soil Mechanics and Geotechnical Engineering, Paris 2013
2 EXPERIMENTAL SET UP AND TEST PROCEDURES
2.1 Test boxes and instrumentation
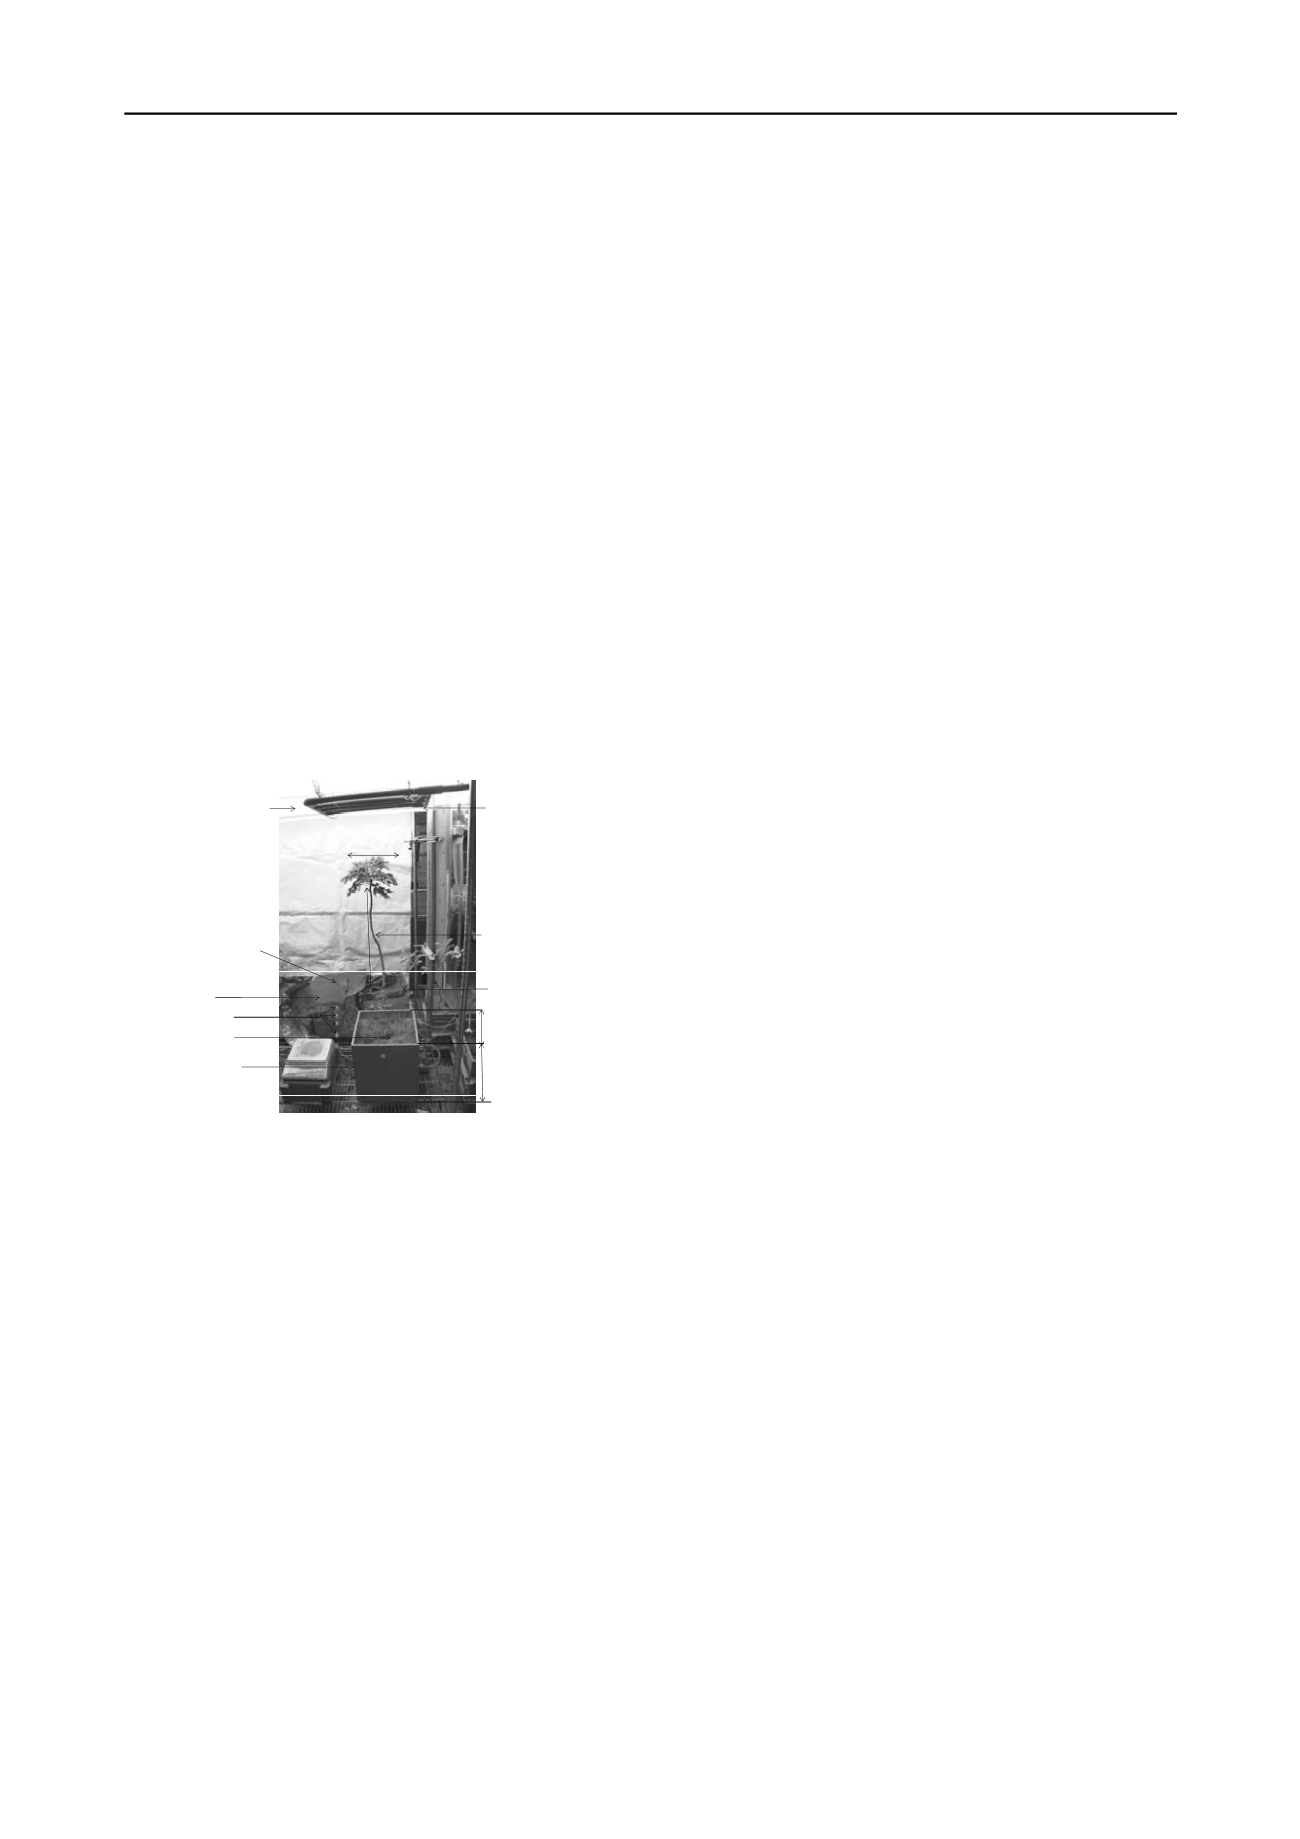
In this study, three test boxes were designed and manufactured.
Two of them were planted with grass (denoted as test box G)
and with tree (denoted as test box T), whereas one was left bare
as a control (denoted as test box B). Figure 1 shows the
overview of the setup of the three boxes in a room, where air
temperature, radiant energy, relative humidity and potential
evaporation rate were controlled at 22.3±1°C, 2.1±1 MJ/m
2
,
43±7 % and 5 ± 0.2 mm/day, respectively. Each test box has a
cross-section dimension of 300 mm x 300 mm and a depth of
350 mm. At depths of 30, 80, 140 and 210 mm below soil
surface in each box, miniature-tip tensiometers were installed to
measure negative pore-water pressure or suction ranging from 0
to 90 kPa. In order to quantify soil suction induced by tree
transpiration in box T, bare soil surface around the tree stem
was covered with a plastic sheet to minimize soil evaporation.
Similarly, soil surface in bare box B was also covered for fair
comparison. In box G, since soil surface was fully vegetated
with grass, it was thus not covered with the plastic sheet and
exposed to atmosphere during testing. At the bottom of each test
box, there were nine drainage holes with diameter of 5 mm each
for free drainage during testing (not shown in the figure).
Cynadon dactylon
Scheffleraheptaphylla
Rainfall sprinkler system
(Intensity of 100 mm/hr)
Fluorescent lamp
(Radiant energy of 2.1MJ/m
2
)
Bare soil covered with
laminatedplastic sheet
900mm
220mm
Box T
Box G
350mm
Box B
Tensiometers
300mm
Figure 1. Overview of the three purpose-built boxes B, G and T in an
atmosphere-controlled room
To allow for photosynthesis, a fluorescent lamp
was used
and it was mounted on top of each vegetated test box. The lamp
emitted a constant daily radiant energy (
R
i
) of 2.1 MJ/m
2
. In
total, 16 measurements of
R
i
were made along soil surface of
boxes B and T using quantum sensors. In box T, any radiant
energy difference between the applied and measured radiant
energy is equal to the energy intercepted by tree leaves. It
should be noted that this calculation neglects (1) reflected
radiant energy at each individual leaf surface due to low albedo
(0.10
–
0.15; Taha et al. 1988) and (2) radiant energy used to
heat up air due to low air density (Blight 2004). Energy
distribution could not be measured in box G because soil
surface was fully covered with grass where quantum sensor
(which has limited size) was difficult to be placed on soil
surface for measurements.
2.2 Soil type and selected plant species
Completely decomposed granite (CDG), which is commonly
found in Hong Kong, was used. Results from sieve and
hydrometer analysis reveal that the gravel, sand, silt and clay
contents of CDG are 19, 42, 27 and 12 %, respectively. Based
on the measured particle-size distribution and Atterberg limit,
CDG may be classified as silty sand (SM) according to the
Unified Soil Classification System
. Each
test box was
compacted with silty sand of which the targeted dry density and
water content by mass were 1496 kg/m
3
(i.e. degree of
compaction of 80 %) and 12%, respectively.
In this study, a grass species (
Cynodon dactylon
) and tree
species (
Schefflera heptaphylla
) were selected for investigation.
The grass species is commonly known as Bermuda grass, which
is a warm-season grass widely cultivated in warm climates of
the world. In box B, seeds of Bermudagrass were distributed
uniformly on soil surface and they were allowed to germinate
and grow for 10 months in the atmosphere-controlled room.
After growing for 10 months, the average lengths of grass shoot
and depth were found to be 90 and 110 mm, respectively. The
LAI of grass is estimated to be 2.2.
For box T, a mature tree,
Schefflera heptaphylla
, which has
a shoot height of 900 mm and root depth of 240 mm (50 %
longer than grass root), was transplanted to the centre of the
box. The tree had a canopy diameter of about 220 mm (73% of
the width of the box T) and the shape of the canopy is spindle
–
shaped. The LAI of the tree is determined to be 4.6. In both
boxes G and T, fertiliser was not added to prevent osmotic
suction induced by changes of salt concentration in soil (Krahn
and Fredlund 1972).
2.3 Test plan and procedures
After preparing all the three test boxes (B, G and T), they were
tested in the atmospheric-controlled room. In each box, rainfall
with intensity of 100 mm/hour and duration of one hour was
applied on box surface using a calibrated rainfall sprinkler
system as shown in Figure 1. This applied rainfall event is
equivalent to the return period of 10 years of rainfall in Hong
Kong (Lam and Leung 1995). Throughout the entire rainfall
event, all drainage holes at the bottom of each test box were
opened to allow for free downward drainage. After rainfall, soil
surfaces in test boxes B and T were covered with laminated
plastic sheet, whereas that for grass box G was left exposed.
Each test box was then monitored for two weeks and any
suction changes at the depths of 30, 80, 140 and 210 mm were
recorded continuously. All drainage holes at the bottom of each
box remained open during the monitoring period.
3 OBSERVED TREE ROOT CHARACTERISTICS
In order to investigate tree root characteristics such as root area
index (RAI) and its distribution within the root zone, the tree
was removed from box T after testing. An image analysis was
then conducted on tree root system using an open source
program, Image J (Rasband 2011). RAI is an index normalising
total root surface area for a given depth range
h
(assumed to
be 10 mm in this study) by circular cross-section area of soil (on
plan), whose diameter is defined as the furthest distance
between two ends of root. It should be noted that RAI of grass
was not measured because the diameter of fine roots was much
smaller than the accuracy of the image analysis.
Figure 2 shows the measured distribution of RAI along root
depth of the tree. Maximum RAI of 0.74 is found near soil
surface. The RAI decreases almost linearly to less than 0.03 at
the root depth of 240 mm. Obviously, RAI can vary differently
from species to species. While the observed linear RAI profile
of the tree in this study is found to be similar to that measured
in sweet gum (Simon and Collison 2002), it is different from
other tree species, black willow, where non-linear RAI profile
was observed (Simon and Collison 2002). In addition to plant
species, RAI can also be affected by soil density. Laboratory
study carried out by Grzesiak (2009) showed that when soil is
denser, plant roots are found to be less uniform along depth.
Obviously, this is because an increase in soil density would


