1177
Technical Committee 106 /
Comité technique 106
procedure was adopted in order to minimize potential
heterogeneities usually present in undisturbed specimens
allowing a better comparison among conventional methods and
the alternative methodology using centrifuge. Table 2 presents
some typical characteristics and index properties of the soils
samples tested. As shown in Table 2, the void ratio of remolded
specimens is greater than undisturbed specimens. This is
justified in seeking to verify possible deformations in softer
soils induced by high acceleration levels. Therefore, the mass of
soil, at a specific remolding water content, for a known volume
for each soil specimen was calculated. The mass of soil was
placed in layers and a tiny compactor was used just to assent
them until the complete volume was achieved.
Table 2 – Characteristics and index properties
Previously to the centrifuge testing, all soil specimens and all
ceramic disks were soaked with distilled - deaired water. The
soil specimens wetting procedure adopted consisted in gradually
spraying the soil specimens with water until reaching a soaked
state, characterized by a thin water layer formed above the top
boundary of the specimen. The water content reached at the end
of the soaking procedure was assumed to be correspondent to
the saturation condition of each specimen. The ceramic disks
saturation procedure consisted in submerging them during 48
hours into a recipient filled with distilled water and by spinning
them up to 500 rpm in the centrifuge in order to flush air
bubbles within them. Thereafter, two setups with 12 mm thick
ceramic disks and two setups with 63mm ceramic disks were
assembled as shown in Figure 2. Subsequently, the four testing
setups were placed into the centrifuge buckets in a symmetric
testing configuration with respect to the centrifuge axis of
rotation in order to avoid in-flight unbalancing.
Figure 2. Setups Details (a) “Bucket X” (12 mm thick ceramic disks);
(b) “Bucket Y” ( 63mm thick ceramic disks).
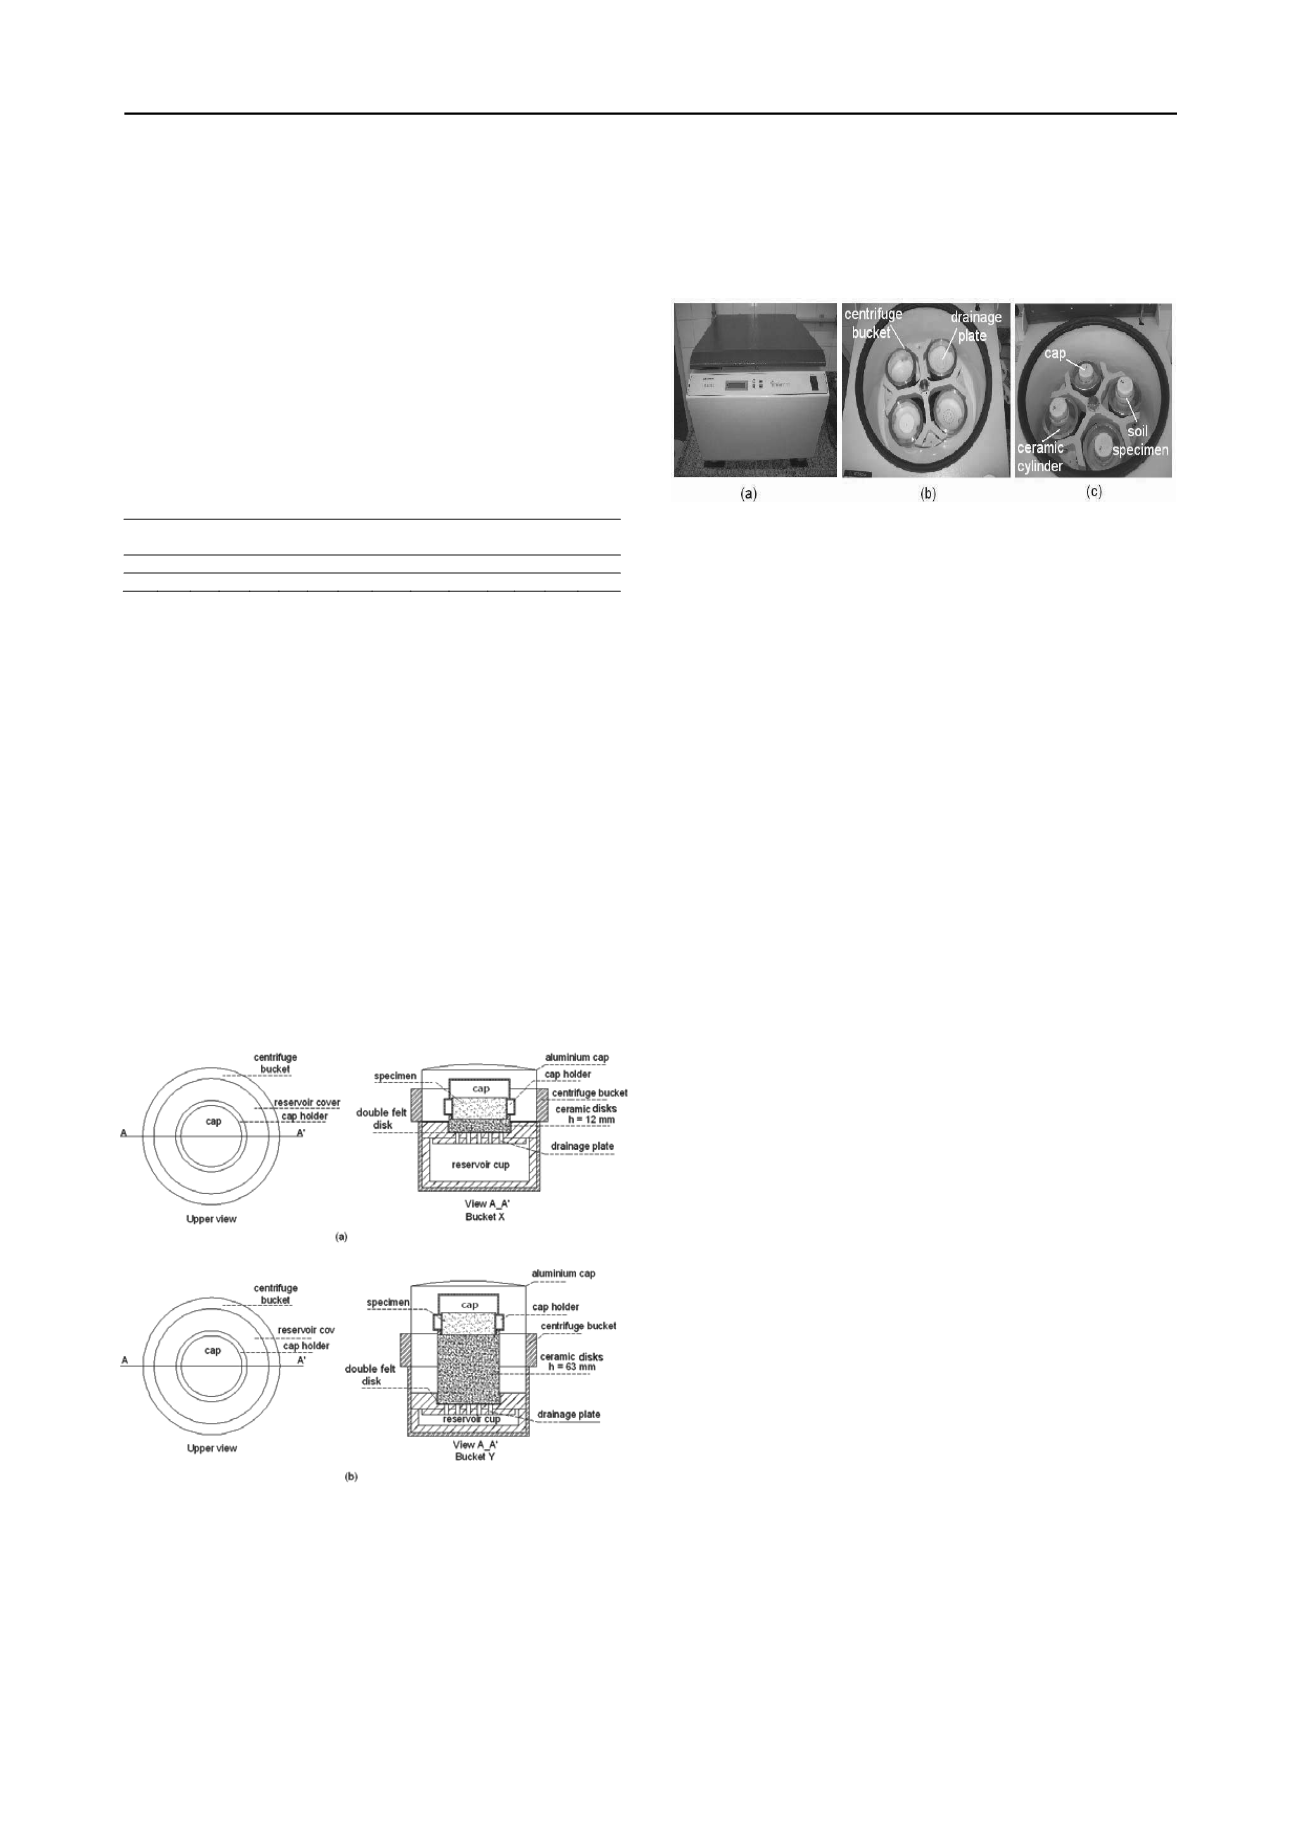
Figure 3 presents the general view of the centrifuge
arrangement before starting the test. The soil specimens´ top
boundary is protected with a PVC cap in order to prevent
evaporation during testing. This cap is fitted over a stiff
aluminum cap fixed in the centrifuge bucket (Figure 2).
Subsequently, the soil specimens are subjected to angular
velocities up to 3000 rpm. The tests were performed with
initially soaked soil specimens displaced over an initially
soaked high flow ceramic disk and submitted to successive
increased gravities inducing successive unsaturated states
without any external interference (even stopping the centrifuge).
Figure 3. Views of Cientec CT 6000 small-scale centrifuge: (a) external
view; (b), (c) internal view.
The methodology allows determining simultaneously two
pairs of soil moisture – suction relationships at each induced
gravity applied. Applying angular velocities of 300, 500, 1000,
1500, 2000, 2500 and 3000 rpm allows determining
experimentally 14 soil moisture – suction relationships. The
proposed setup configuration allows evaluating the data
repeatability once the specimens with same ceramic disk
thickness are subject to similar suction magnitudes and,
therefore, they should have similar moisture changes in a
specific testing step (denoted by similar changes in specimens´
weight). Due to the absence of in-flight instrumentation, the no-
flow steady-state moisture profile condition was checked by
stopping the centrifuge equipment and checking any change in
each specimen´s weight. The equilibrium condition is yielded
when a constant specimens´ weight is achieved. After reaching
the no-flow steady-state moisture profile condition at the 3000
rpm run, all soil specimens were oven dried for final water
content determination. The water content magnitudes of each
intermediary testing step were then back calculated and the
respective SWRC plotted.
In order to evaluate any potential effect of consolidation
during centrifugal flow, it was evaluated the soil specimen´s
height at each centrifuge monitoring stops. It was not observed
any volume change for angular velocities lower than 1500 rpm.
For angular velocities higher than 1500 rpm, it was observed
changes in the specimen´s height of 0.8 mm, 0.4 mm for RY,
UY, respectively. These height changes correspond to 4 %, 2 %
of volume changes respectively. Once the volume changes
observed were small, the corresponding volumetric water
contents were evaluated considering the initial soil unit weight
even for angular velocities higher than 1500 rpm.
The
corresponding suction magnitudes of the tests that underwent
volume changes were evaluated considering the actual radius
magnitude calculated at each testing step.
4 RESULTS AND DISCUSSION
Figures 4 and 5 present the comparison among the SWRC
obtained by conventional methods and depicted using the van
Genuchten (1980) mathematical model, and the experimental
data obtained following the methodology proposed herein.
Figure 4 shows the RY testing results while Figure 5 shows the
UY testing results.
Analyzing the results in Figures 4 and 5 it can be observed
that the experimental data obtained through the proposed
methodology agrees with the experimental data obtained by
conventional methods such as filter paper method, plate
extractor and suction funnel. Concerning the SWRC
mathematical description, it can be noted in Figures 4 and 5 that
the van Genuchten (1980) model describes accurately the soil´s
suction – moisture relationship observed experimentally.
Sand Silt Clay LL LP
IP
W
γ
γs
γd
e
n
Sr ASTM
(%) (%) (%) (%) (%) (%) (%) kN/m³ kN/m³ kN/m³
(%) (%) (2003)
RY 55.0 36.0 7.0 50.2 24.6 25.6 19.3 16.6
26.7
13.9 0.9 47.8 56.3
SC
UY 55.0 36.0 7.0 50.2 24.6 25.6 12.0 17.1
26.7
15.3 0.8 42.7 42.8
SC


