670
        
        
          Proceedings of the 18
        
        
          th
        
        
          International Conference on Soil Mechanics and Geotechnical Engineering, Paris 2013


            Proceedings of the 18


            th


            International Conference on Soil Mechanics and Geotechnical Engineering, Paris 2013


          where
        
        
          ,sin


            m


            f


            j


          =
        
        
          sin


            m


            f


            j


          ¶ 
        
        
          . When
        
        
          1


            m


            h


          =


          , Equations (4) and
        
        
          (16) are identical which means that all strains are then plastic.
        
        
          As shown in Figure 5 the isochoric stress paths now start
        
        
          drifting early towards triaxial extension and compression
        
        
          modes. As plasticity starts early on, the drift is severe in the
        
        
          case of this simple hardening model. A drift of such an extent is
        
        
          not observed experimentally.
        
        
          Associated flow rule can be retrieved by putting
        
        
          0
        
        
          0


            c


            j


          =
        
        
          such
        
        
          that


            m m


            y j


          =
        
        
          . The plots shown in Figure 5 demonstrate that
        
        
          associated flow rule is not a solution to the drift problem.
        
        
          Moreover, isochoric effective stress paths in the


            p-q


          plane are
        
        
          highly unrealistic.
        
        
          5 RADIAL MAPPING AND A POSSIBLE
        
        
          GENERALIZATION
        
        
          Radial mapping has been used by a number of authors (


            e.g


          .,
        
        
          Benz 2007, Tsegaye
        
        
          1
        
        
          2010, Tsegaye


            et al


          . 2012). The
        
        
          implication of radial mapping is next investigated for the
        
        
          elastoplastic models considered in sections 3 and 4.


            5.1 Isotropy and radial mapping


          As shown herein before, Mohr-Coulomb type plastic potential
        
        
          function introduces unrealistic drift in stress path for radial
        
        
          strain increments. For an initially isotropic state, such a drift is
        
        
          not supported by experiments. True triaxial tests show that for
        
        
          an initially isotropic state and proportional loading, stress paths
        
        
          are nearly radial. Hence, radial mapping may be a reasonable
        
        
          assumption. Radial mapping can be interpreted that plastic
        
        
          strains orient themselves towards isotropic stress state (


            i.e


          .,
        
        
          radial to the hydrostatic axis). Coaxiality is maintained between
        
        
          principal strain increments and principal stresses for radially
        
        
          proportional loading paths.
        
        
          Radial mapping can be easily achieved by considering Lode
        
        
          angle independent potential functions. For pressure sensitive
        
        
          materials like soils a function of the Drucker-Prager type,
        
        
          ensures radial return.
        
        
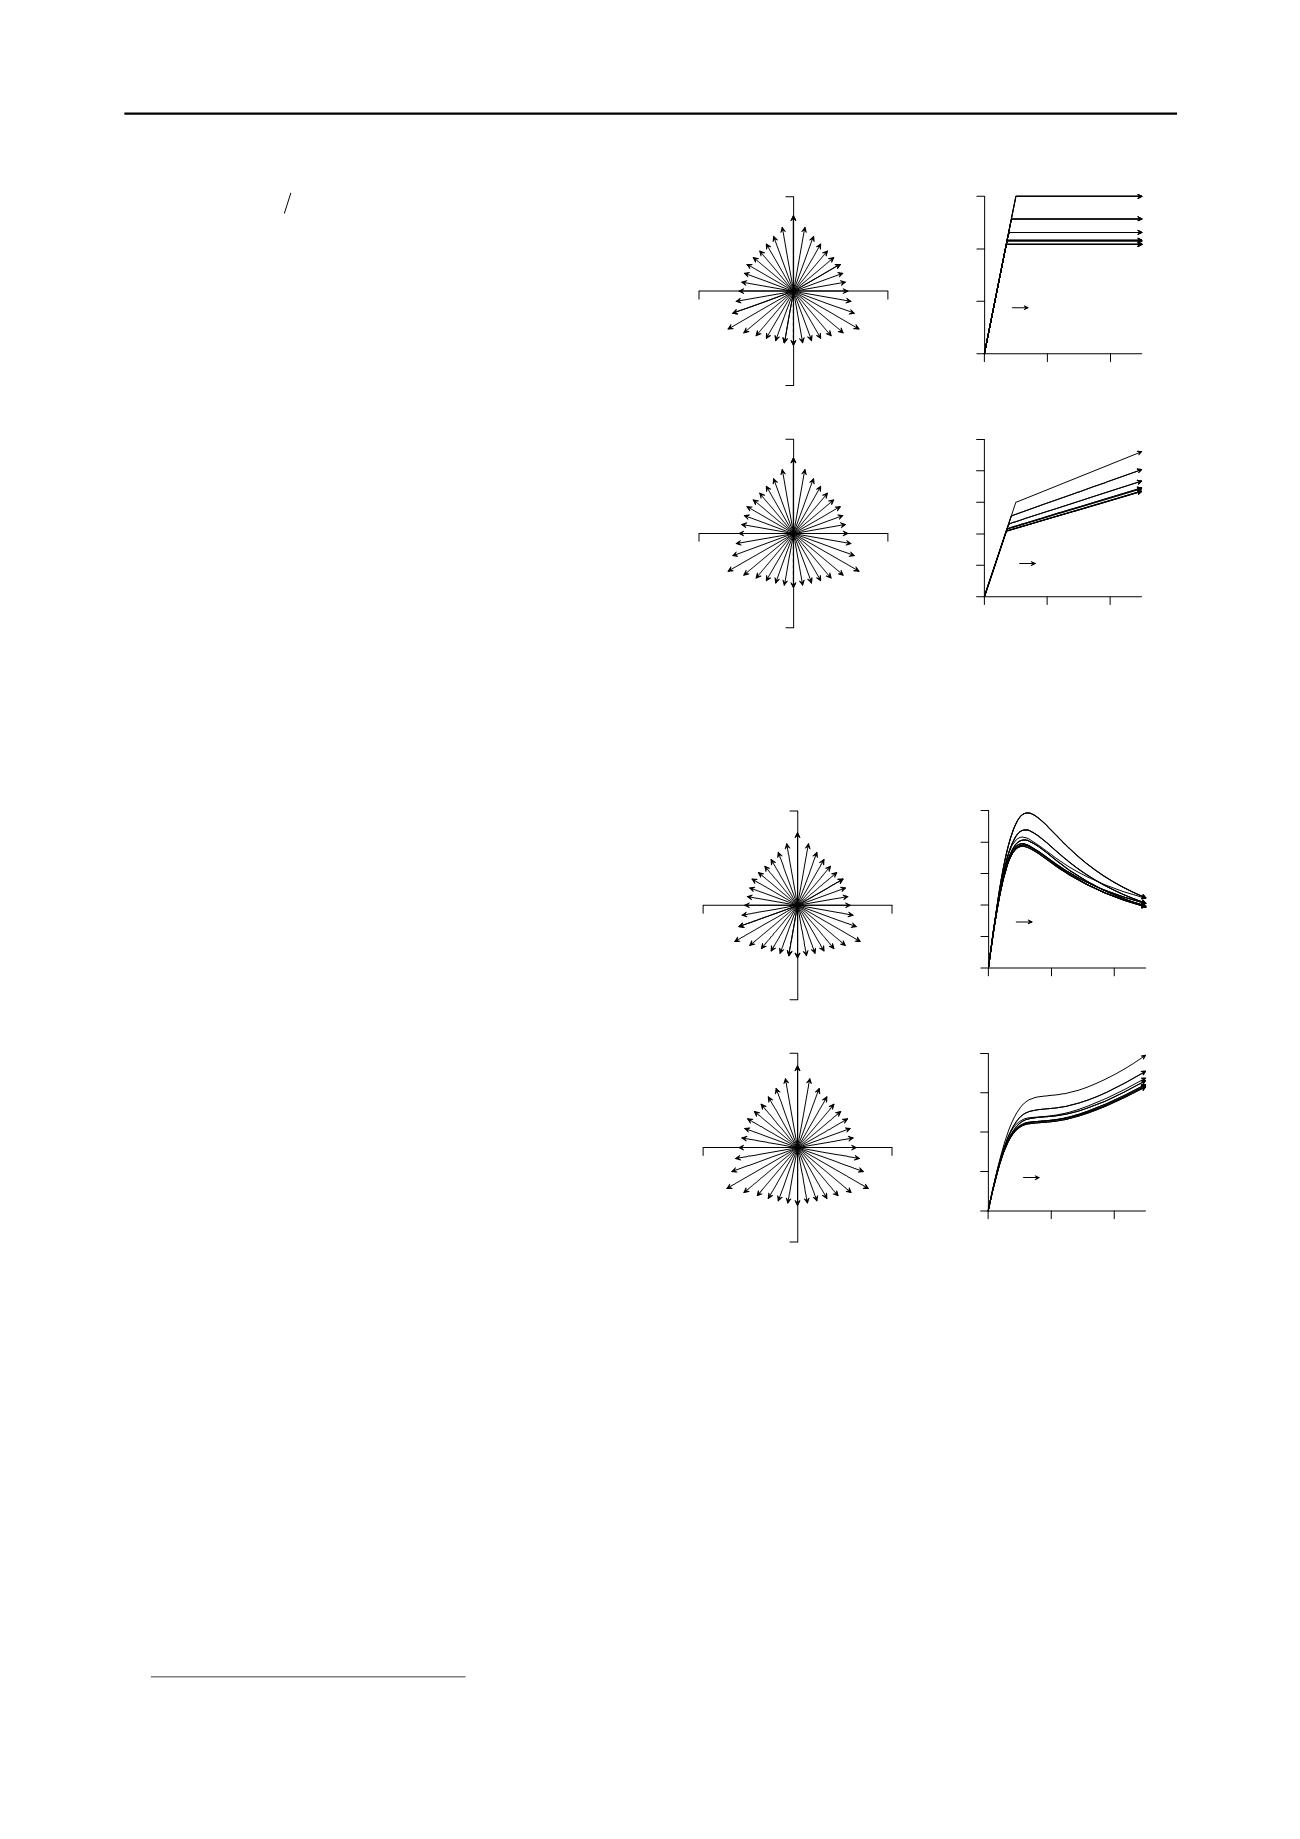
          In Figure 6, responses of an elastic perfectly plastic model with
        
        
          a Mohr-Coulomb yield function and Drucker-Prager plastic
        
        
          potential function are plotted. As shown in the plots, isotropic
        
        
          radial strain increments produce radial stress paths. There is no
        
        
          deviatoric drift. The strength variation in between triaxial
        
        
          extension and compression is captured. Notice, however, the
        
        
          minimum strength is not due to triaxial extension but an in-
        
        
          between state that is located at the shortest distance from the
        
        
          hydrostatic axis. Figure 7 illustrates response of the simple
        
        
          hardening model with a Drucker-Prager plastic potential
        
        
          function to isochoric radial strain increments. The response in
        
        
          the deviatoric plane remains radial and the plots in


            p-q


          plane
        
        
          and


            -q


          plane are smooth.


            5.2 Anisotropy and radial mapping


          Anisotropy can be due to fabric constraint and/or induced by
        
        
          loading history, for example during deposition. It is important to
        
        
          remark here that if a generalization is to be made, at this stage it
        
        
          rests on very limited experimental data. For example
        
        
          considering the tests by Jafarzadeh


            et al.


          (2008), if each test was
        
        
          performed on a sample prepared at a different initial void ratio,
        
        
          stress path contours at constant deviatoric strain may not give a
        
        
          correct picture of the deviatoric response contours.
        
        
          1
        
        
          Previous papers by the first author are published under the last
        
        
          name Tsegaye.
        
        
          -1.5
        
        
          0
        
        
          1.5
        
        
          -1.5
        
        
          0
        
        
          1.5
        
        
          0
        
        
          0.004 0.008


          0
        
        
          40
        
        
          80
        
        
          120
        
        
          160
        
        
          200
        
        
          q


          p
        
        
          =35
        
        
          0
        
        
          ,


          max
        
        
          =5
        
        
          0
        
        
          -1.5
        
        
          0
        
        
          1.5
        
        
          -1.5
        
        
          0
        
        
          1.5
        
        
          0
        
        
          0.004 0.008


          0
        
        
          40
        
        
          80
        
        
          120
        
        
          q


          p
        
        
          =35
        
        
          0
        
        
          ,


          max
        
        
          =0
        
        
          0
        
        
          Figure 6: Plots of isochoric stress paths (for radial isochoric strain
        
        
          increments, a) in a deviatoric plane (normalized by mean normal stress)
        
        
          b)


            p-q


          plane and c) shear strain deviatoric stress plot, for an elastic
        
        
          perfectly plastic Mohr-Coulomb model with a Drucker-Prager plastic
        
        
          potential function. For all simulations G=5000kPa and v=0.3 are used.
        
        
          -1.5
        
        
          0
        
        
          1.5
        
        
          -1.5
        
        
          0
        
        
          1.5
        
        
          0
        
        
          0.004 0.008


          0
        
        
          20
        
        
          40
        
        
          60
        
        
          80
        
        
          q


          p
        
        
          =35
        
        
          0
        
        
          ,


          c
        
        
          =30
        
        
          0
        
        
          -1.5
        
        
          0
        
        
          1.5
        
        
          -1.5
        
        
          0
        
        
          1.5
        
        
          0
        
        
          0.004 0.008


          0
        
        
          10
        
        
          20
        
        
          30
        
        
          40
        
        
          50
        
        
          q


          p
        
        
          =30
        
        
          0
        
        
          ,


          c
        
        
          =30
        
        
          0
        
        
          Figure 7: Effective stress path plots for radial isochoric strain
        
        
          increments, a) deviatoric plane (normalized by mean normal stress), b)


            p-q


          plane, c) deviatoric strain-deviatoric stress, for an elastic plastic
        
        
          Mohr-Coulomb model with Drucker-Prager plastic potential function.
        
        
          For all simulations G=30000 kPa, G
        
        
          p
        
        
          =30000 kPa and v=0.3 are used.
        
        
          Aside from that, the following observations could be noted.


          Initial anisotropy fades away during plastic deformation


          At larger mobilizations the critical state surface is not
        
        
          significantly affected by anisotropy.
        
        
          The use of radial mapping for anisotropic initial stress state
        
        
          yields


          non-coaxial principal stress and principal strain
        
        
          increments. Since the direction of plastic strains is
        
        
          known a priori, the degree of non-coaxiality can be
        
        
          calculated as a state variable.


          fading memory of anisotropy and non-coaxiality with
        
        
          plastic distortion.