626
Proceedings of the 18
th
International Conference on Soil Mechanics and Geotechnical Engineering, Paris 2013
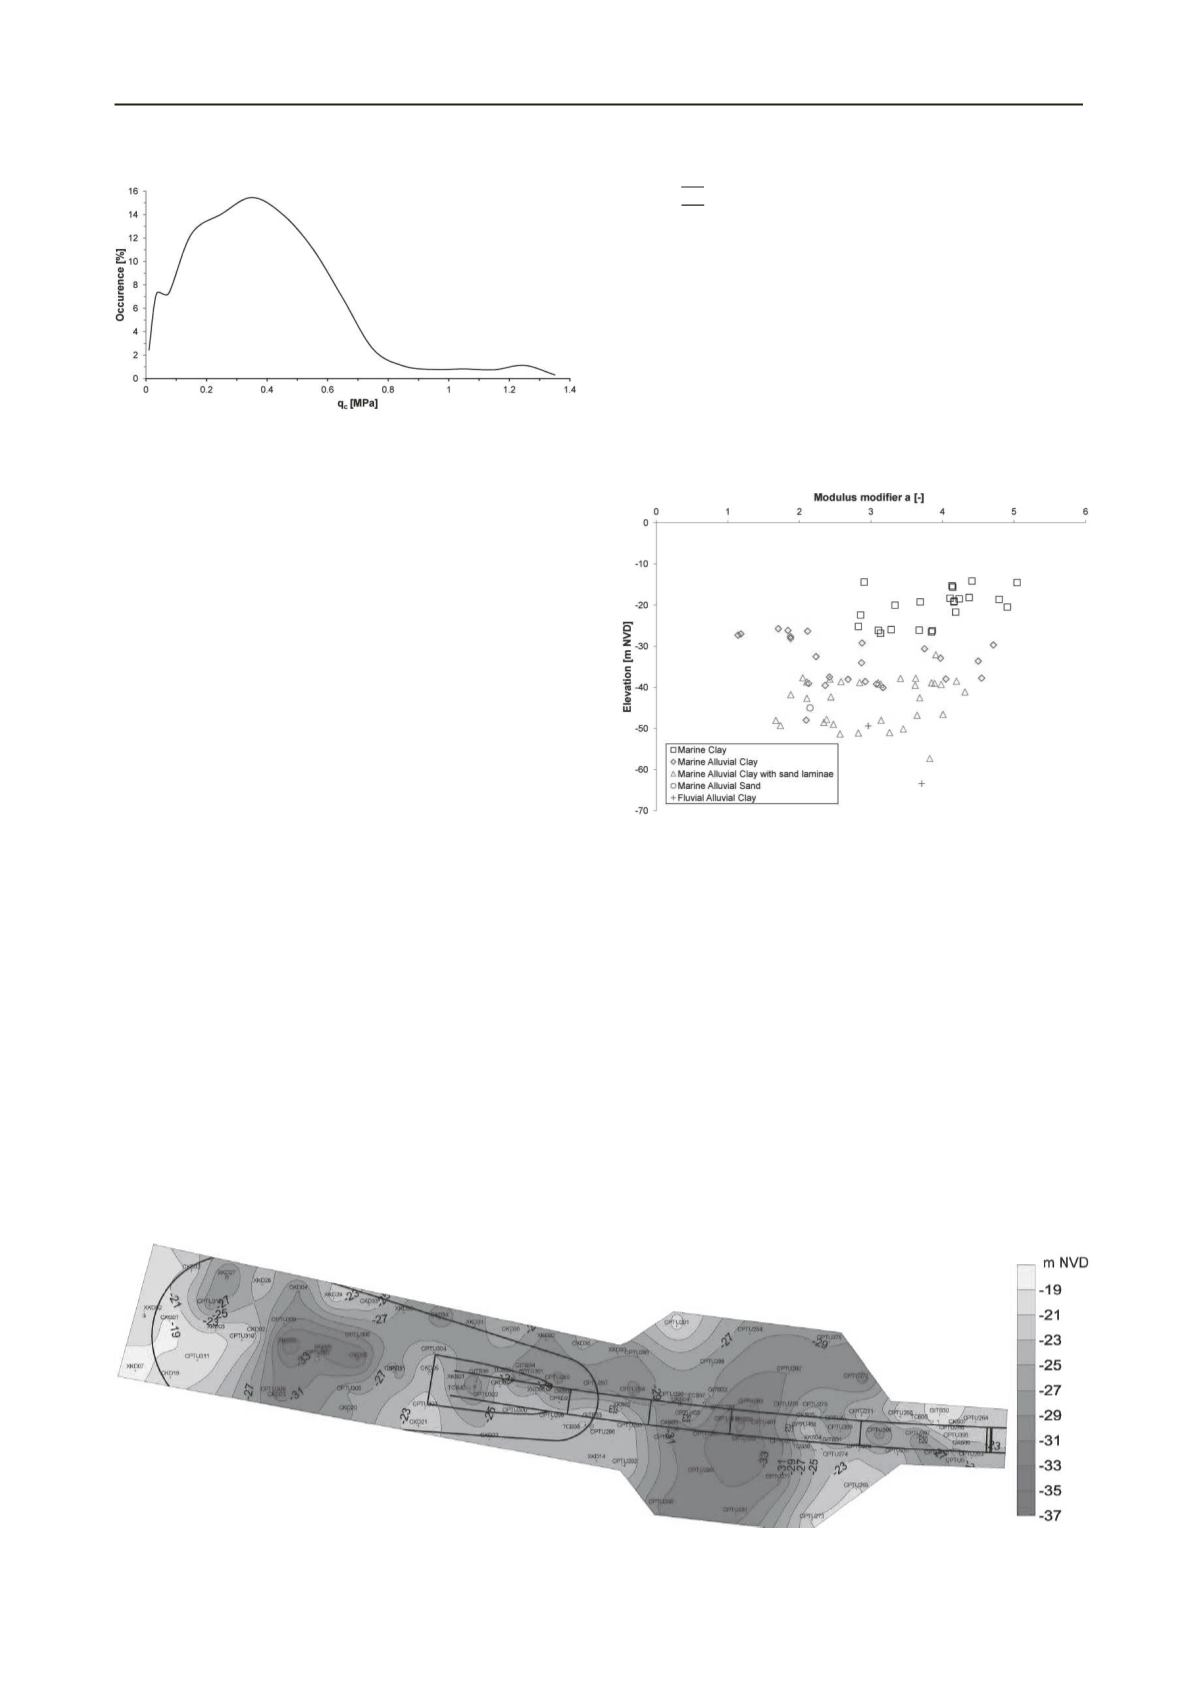
Figure 5. Example of q
c
frequency distribution "foot print" for Marine
Clay.
Based on the frequency distributions, representative ranges were
established for the three principal CPTU properties, which in
turn were used as filter criteria for a template predicting the
geological unit.
The pore pressures varied greatly within each geological unit
and were not used as a criterion for the geological interpreta-
tion, but merely as a guide when visually cross checking the re-
sults.
The interpretation template set up in this way worked on the
premise that if a data set fell within the established "foot print"
criteria, the template would subsequently yield the associated
geological unit. The criteria were regarded as a key to a typical
geological interpretation, not an unambiguous analysis. The fi-
nal geological interpretation was therefore based on additional
factors such as the combined appearance of the qc, Rf and u2
distributions combined with cross referencing to nearby bore-
holes.
Approximately 400 Nos. CPTUs (including those carried out
during the Preliminary Design investigations) were interpreted
using this method. This allowed for a 3D stratigraphical model
to be set up for the geotechnical interpretation of the subsurface
conditions surrounding the tunnel alignment, see e.g. Figure 6.
7 GEOTECHNICAL INTERPRETATION
The interpretation of the results of the oedometer tests carried
out yielded the modulus number, m, recompression modulus
number, m
r
, secondary compression index, C
α
, secondary re-
compression index, C
α
r
, coefficient of consolidation, c
v
and ex-
cess preconsolidation pressure,
∆
σ
'
pc
(=
σ
'
pc
-
σ
'
v0
).
The use of CPTUs was a key element in the evaluation of the
settlement/stiffness variation along the alignment of the Having
established the modulus number, m, for a range of soil deposits
through laboratory oedometer testing, the modulus modifier, a,
can be determined based on the formula:
=
(1)
where q
tM
is the stress-adjusted cone resistance and
σ
r
is a refer-
ence stress (=100 kPa).
Based on the modulus number from the oedometer tests and
the stress adjusted cone resistance from CPTU testing, the mod-
ulus modifier, a, was derived or each soil deposit from (1).
The modulus modifier is plotted in Figure 7 assessing all oe-
dometer results for fine grained samples. The results shown in
this figure indicate relatively little data scatter and a general
grouping of fine grained soils around 2 to 5 and 60 to 90 for the
coarse grained soils (the latter values are not shown in Figure
7).
Figure 7. Modulus modifier, a, for selected geological units as derived
from oedometer and CPTU testing results.
The recompression branch of the oedometer tests on fine
grained soils indicated a linear correlation rather than a log-lin-
ear correlation. Further, the recompression modulus number, m
r
,
resulting from the reloading branches was found to vary with
load for the fine grained soils. A reasonable approximation was
achieved by applying different m
r
values above and below an in
situ stress of 100 kPa.
The resulting recompression modulus modifier, a
r
, was
therefore defined for in situ stress below and above 100 kPa.
Relatively little data scatter was observed in the a
r
values,
with a general grouping of a
r
values for fine grained soils
around 14 to 25 and 14 to 33 for in situ stress above and below
100 kPa, respectively.
Figure 6. Example of contour plot generated based on the compiled 3D stratigraphical model showing top of Continental/Marine Alluvial deposits in
the location of the East Artificial Island.


