621
Technical Committee 102 /
Comité technique 102
soils, R (from particle size distribution tests), and the specific
gravity of the clasts (Gc) and infill soils (Gs).
The ratio of volume of cavities to volume of solids, e
c
, and
the relative volume of cavities with respect to the total volume
for debris fill (Pc) may be expressed as:
e
c
= e
t
– e
s
/ (1+R.Gs/Gc)
(1)
P
c
= e
c
/ (1+ e
t
)
(2)
Based on the above equations, and using the average values
of e
t
(=0.43), e
s
(=0.62), R (43%/57% = 0.75) and specific
gravity (Gs = 2.65; Gc = 2.4), the average volume of cavities
within the poorly controlled debris fills was calculated at 6.6%
of fill volume. The calculated volume of cavities agrees well
with field experiment estimates of cavity volume made at other
inert debris fill sites in Irwindale with similar materials and
filling practices. Those evaluations included a controlled in-situ
pilot grouting test which resulted in a grout take of 4.4 to 7.2%
of total volume, and an in-situ dynamic compaction test which
resulted in a volume reduction of 5 to 7% of total fill volume
(AMEC, 2008).
However, not all of the calculated cavity volume is available
for fines migration / collapse. Actual volumetric strain and the
resulting settlement is proportional to the volume of cavities
that are closed or filled with fines in the event of an earthquake
or hydrocollapse caused by rise in groundwater level. This is a
function of many factors including the grain size distribution of
the oversize clasts, accessibility of cavities to overlying infill
soils, cohesion of infill soil and intensity and duration of
seismic shaking, and cannot be reliably estimated in the absence
of material-specific physical modeling. Therefore, a parametric
settlement evaluation considering various percentages (p) of
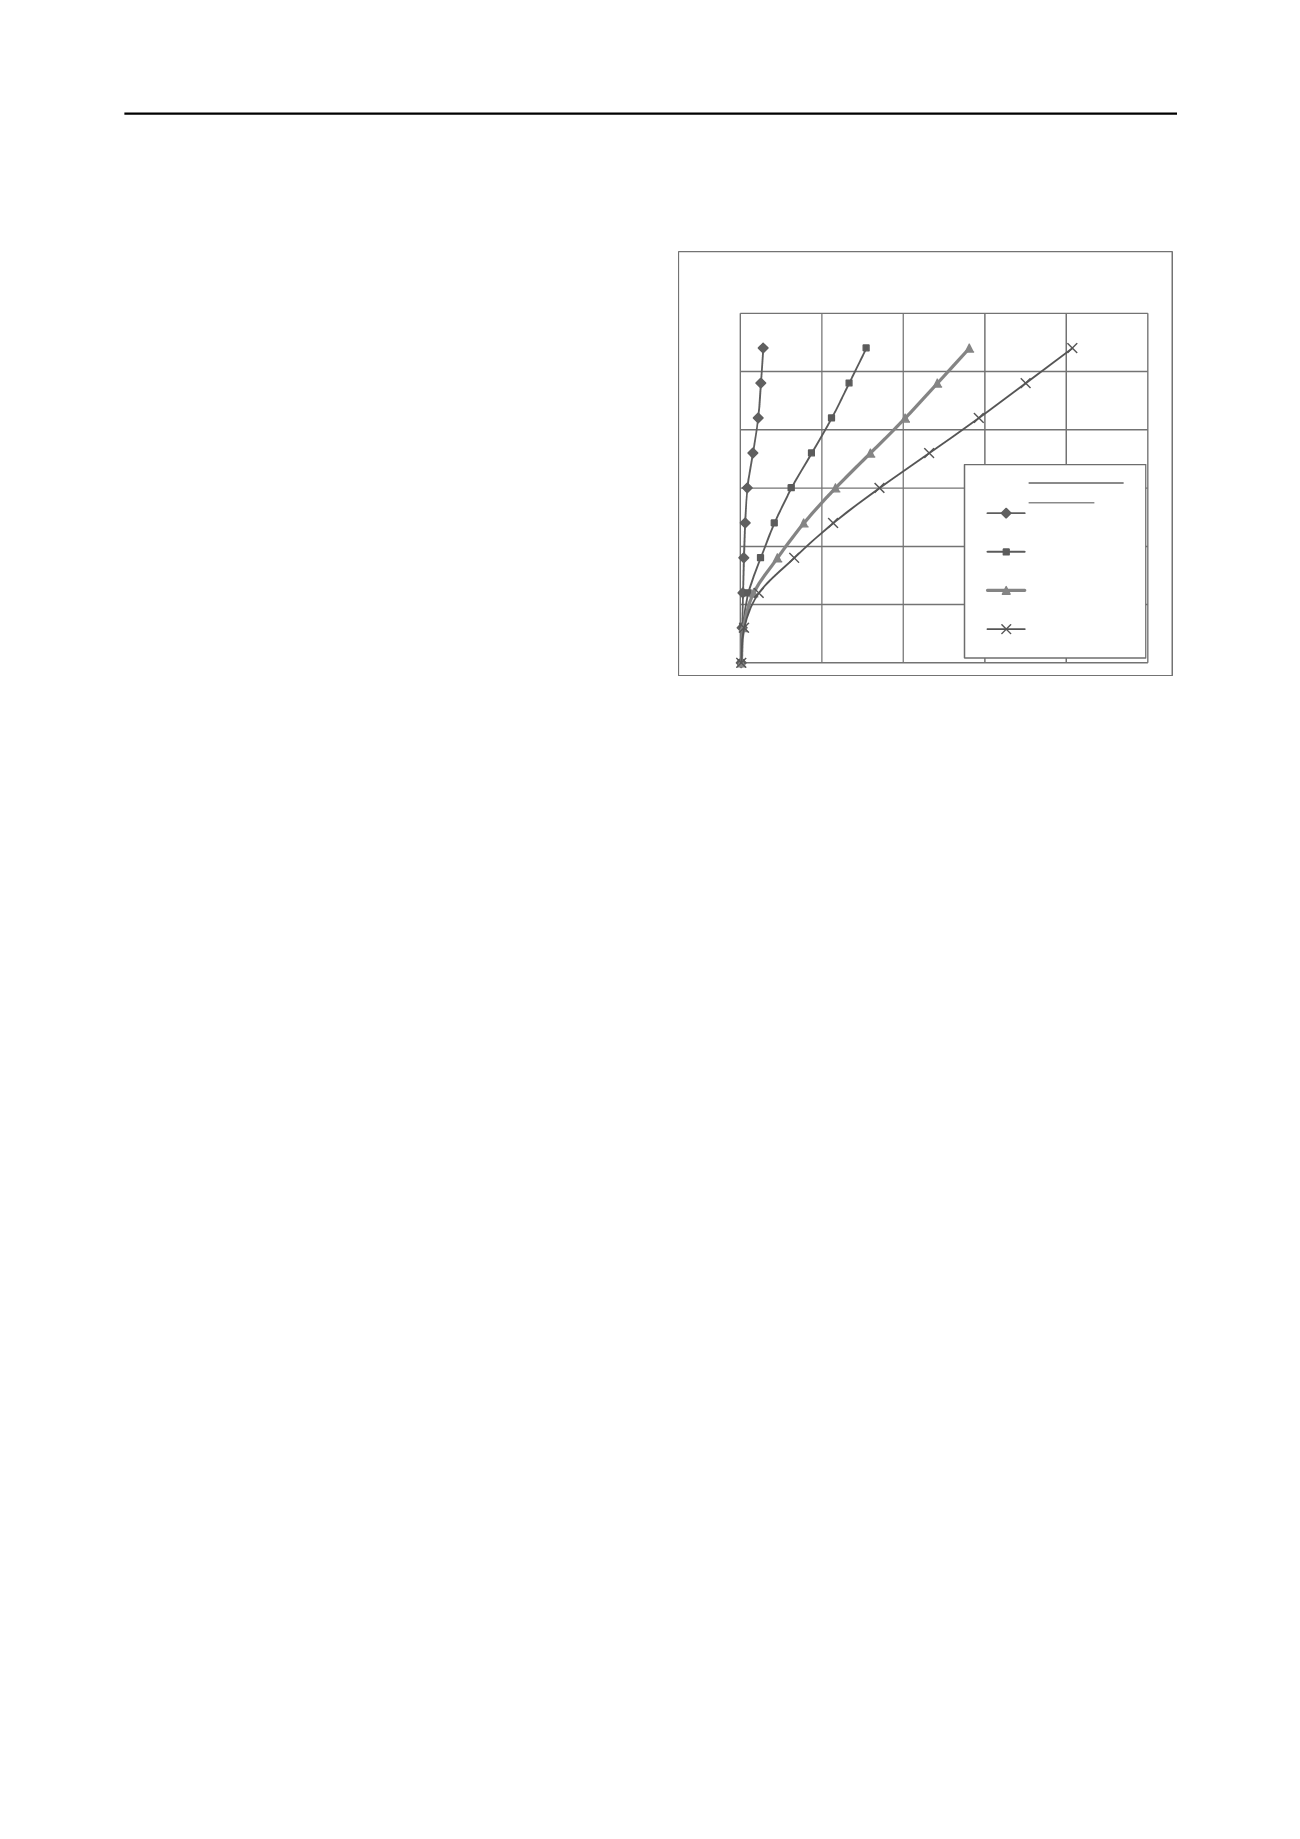
total cavity volume becoming filled was performed. The results
are summarized as average settlement versus depth plots (Figure
3). The settlements shown in Figure 3 for each value of p,
represent the average of the calculated settlements at six BPT
locations across the site. Although the total thickness of debris
fill was similar at each location (approximately 33 m), the
thickness of the poorly controlled, layered rubble fill vulnerable
to fines migration/collapse was variable (ranging from 15.6 to
25.0 m).
The average settlement corresponding to 20% of cavities
filled (p = 20%), was computed at 28 cm (approximately 1.32%
of poorly controlled debris fill thickness or 0.85% of total debris
fill thickness). The latter value compared favorably with some
case histories of dry compacted fills in southern California
which settled by 0.6 to 0.9 percent of fill thickness during the
M6.6, 1971 San Fernando, and the M6.7, 1994 Northridge
earthquakes, under ground accelerations comparable to the
design ground motions for the site. Considering the significant
heterogeneity of the debris fills, the seismic settlements could
be higher or lower than that predicted for p = 20%. To bracket
this uncertainty, seismic settlements under the design
earthquake were calculated for ‘p’ ranging from 10% to 30%.
The resulting settlements ranged from 0.4 to 1.1 percent of total
debris fill thickness.
A 12 m thick zone of debris fill immediately above the
current groundwater level could become saturated if the
groundwater level was to rise to the historic high groundwater
level. This zone has not been saturated since the time of
placement. Settlement due to groundwater saturation was
considered to result from the same mechanisms of fines
migration and collapse, and was assumed to be of the same
order of magnitude as the seismic settlements. These
settlements, estimated to range from 75 mm to 150 mm, occur
approximately 24 m below ground surface (the depth of the high
groundwater level below ground surface). Because the same
mechanisms (migration of sands into open voids and collapse)
apply to both seismic settlement and settlement due to
groundwater rise, the two components of settlement (seismic
and hydrocollapse) are not considered to be cumulative.
0
5
10
15
20
25
30
0
100
200
300
400
500
Depth (m)
Average Total Seismic Settlement (mm)
% of Cavities
Filled (p)
0%
10%
20%
30%
Figure 3 Distribution of Seismic Settlement with Depth
4 REMEDIAL MEASURES
The remedial measures recommended for limiting settlement at
the site to within agency-defined guidelines or structural
tolerances, consisted of partial removal of the existing debris fill
and replacement with a properly processed and compacted fill
cap. The required cap thickness could also be achieved by a
shallower removal and replacement combined with in-situ
ground improvement of the lower part of the debris fill by
dynamic compaction. With increasing thickness of cap, the fill
thickness left in place that is vulnerable to settlements would
decrease. The cap will also help attenuate the differential
settlement taking place at depth as it manifests at the surface of
the fill cap.
The surface manifestation of settlement was simulated by
numerical modeling using FLAC. A representative two-
dimensional cross section across the entire site was considered.
The fill cap was modeled as a non-linear elastic – perfectly
plastic Mohr-Coulomb material. The initial shear modulus for
the cap was based on the average shear wave velocity of 268
m/sec measured in the compacted fill. The modulus
degradation curve was based on the Seed-Idriss relationship for
sand. The calculated seismic / hydrocollapse settlement of the
debris fill underlying the fill cap, was applied as nodal
displacement boundary conditions at the base of the cap. Since
the thickness of poorly controlled rubble fill and the
corresponding settlements are variable across the site, the nodal
displacements were specified as randomly varying over the
range of settlements calculated at the 6 BPT locations.
The nodal displacements (ρ
n
) were generated as follows:
ρ
n
= ρ
min
+ r. (ρ
max
- ρ
min
)
where, r is a random number between 0.0 and 1.0 (determined
by a random number generator for the numerical analyses) and
ρ
min
and ρ
max
are the minimum and maximum values,
respectively, of calculated seismic/hydrocollapse settlements,
for a given value of p. The specified random nodal
displacements were applied at 1.5 m horizontal intervals along
the base of the cap. The modeling was performed for p = 10%,
20% and 30%.
Typical FLAC analysis results as illustrated in Figure 4,
show the original and deformed shape (grid) of a segment of the
fill cap as a result of the random differential settlement applied
at the base of the cap, for cap thicknesses of 12, 18 and 24 m,
respectively. As the fill cap thickness increases, the magnitude
of the total and differential settlement of the material left in


