620
Proceedings of the 18
th
International Conference on Soil Mechanics and Geotechnical Engineering, Paris 2013
The site is vulnerable to relatively high levels of seismic
loading, with a design peak ground acceleration of
approximately 0.53g per the building code. Deaggregation
analysis indicated the corresponding moment magnitude to be
6.7. The area is zoned for industrial or commercial
development. The owners are evaluating remedial measures to
make the site suitable for building development.
There are no industry-accepted standards or case histories to
predict settlements of inert debris fill containing significant
oversize fragments and significant open cavities. Case histories
of seismic settlements of unsaturated fills are generally limited
to earthfill/rockfill dams and compacted soil fills. Laboratory
cyclic simple shear test data relating cyclic shear strain to
volumetric strain, that may be used to estimate the settlement of
unsaturated fills under seismic shaking, are limited to sands
(Silver and Seed 1971, Pyke et al 1975), and finer grained
compacted fills (Stewart et al 2002). Charles (2008) documents
case histories of long-term settlement and collapse potential of
uncontrolled opencast mining backfills in Britain. The City of
Irwindale is currently conducting a laboratory study to evaluate
the potential for wetting induced settlements (hydrocollapse) in
inert debris fills.
2 FIELD INVESTIGATIONS
Field investigations for this site included Becker hammer
borings, surface and downhole geophysical surveys, downhole
video logging, test excavations and large scale in-situ density
and grain size distribution tests. Neither the Becker penetration
tests (BPTs) nor the surface and downhole seismic surveys,
proved to be suitable to characterize the heavily nested and
voided nature of the fills. The presence of very large size
fragments appear to significantly skew the measured Becker
blow counts and shear wave velocities, making these methods
incapable of adequately differentiating between well
compacted, grading code - compliant fills (derived from the
same debris materials), and the loose debris fills with
voids/cavities. This conclusion has been confirmed by studies
performed by the City of Irwindale at other debris fill sites
(Geomatrix, 2007).
Mapping of two deep test excavations to 21 m depth in the
poorly controlled debris fill, confirmed the layered filling
pattern consisting of thick rubble fill lifts capped by thin soil
layers. The layered filling pattern was also apparent in the BPT
logs. The rubble fill consisted of concrete clasts and blocks up
to 2 m in size (with abundant rebar), mixed with brick, tiles,
asphalt concrete, crushed glass and variable amounts of soil
infill. Large voids, cavities and nesting were very common.
Eight large diameter ring density tests (1.8 m diameter x 1.5
m deep) performed as per ASTM D5030 in the inert debris fill
at various depths (ranging from 5 to 15 m below ground
surface) in the test excavations, and eight sand cone tests
performed on soil layers or soil rich fills gave the following
results.
Table 1. Results of In-situ Density Tests
In-situ Dry Density (gm/cc)
Material
Range
Average
Average Void
Ratio
Inert Debris Fill
1.22 – 2.03
1.77
0.43 (e
t
)
Soil Layers
1.45 – 1.86
1.64
0.62 (e
s
)
The in-situ densities of the inert debris fill were compared
to field maximum achievable density (MAD) tests performed on
inert debris materials placed in 30-cm thick lifts and compacted
by 50 passes of heavy earthmoving equipment (combination of
Caterpillar 820 front end loader and 825 compactor). The
corresponding MAD dry densities ranged from 2.03 to 2.13
gm/cc.
A qualitative evaluation of the voided / nested structure of
the inert debris fill was performed by measuring the rate of
water percolation in large diameter test holes. After completing
the large diameter in-situ density tests, the plastic sheeting used
to line the test hole was pulled out and the water level drop was
monitored. The water levels dropped very rapidly (emptied in a
matter of minutes) in test holes in debris fills, while the water
levels stayed full for several days in the MAD tests holes,
confirming the presence of significant voids / cavities in the
debris fill.
Field bulk gradation tests performed on the bulk samples
excavated from the density test pits showed the following
distribution:
Table 2. Summary of Field Gradation Test Results
Material Size
Range (%)
Average (%)
Boulders (>300 mm)
3 to 23
11
Cobbles (>75 mm)
10 to 25
18
Gravels (>19 mm)
6 to 20
14
Finer than (19 mm)
44 to 66
57
Visual observations of the materials removed from the test
excavations suggest that the oversize fraction is greater than the
amounts listed above, since representative amounts of very
large concrete clasts could not be included in the material from
1.5 m diameter test holes. The actual boulder size fraction (>
300 mm) was estimated to be in excess of 20 percent by weight.
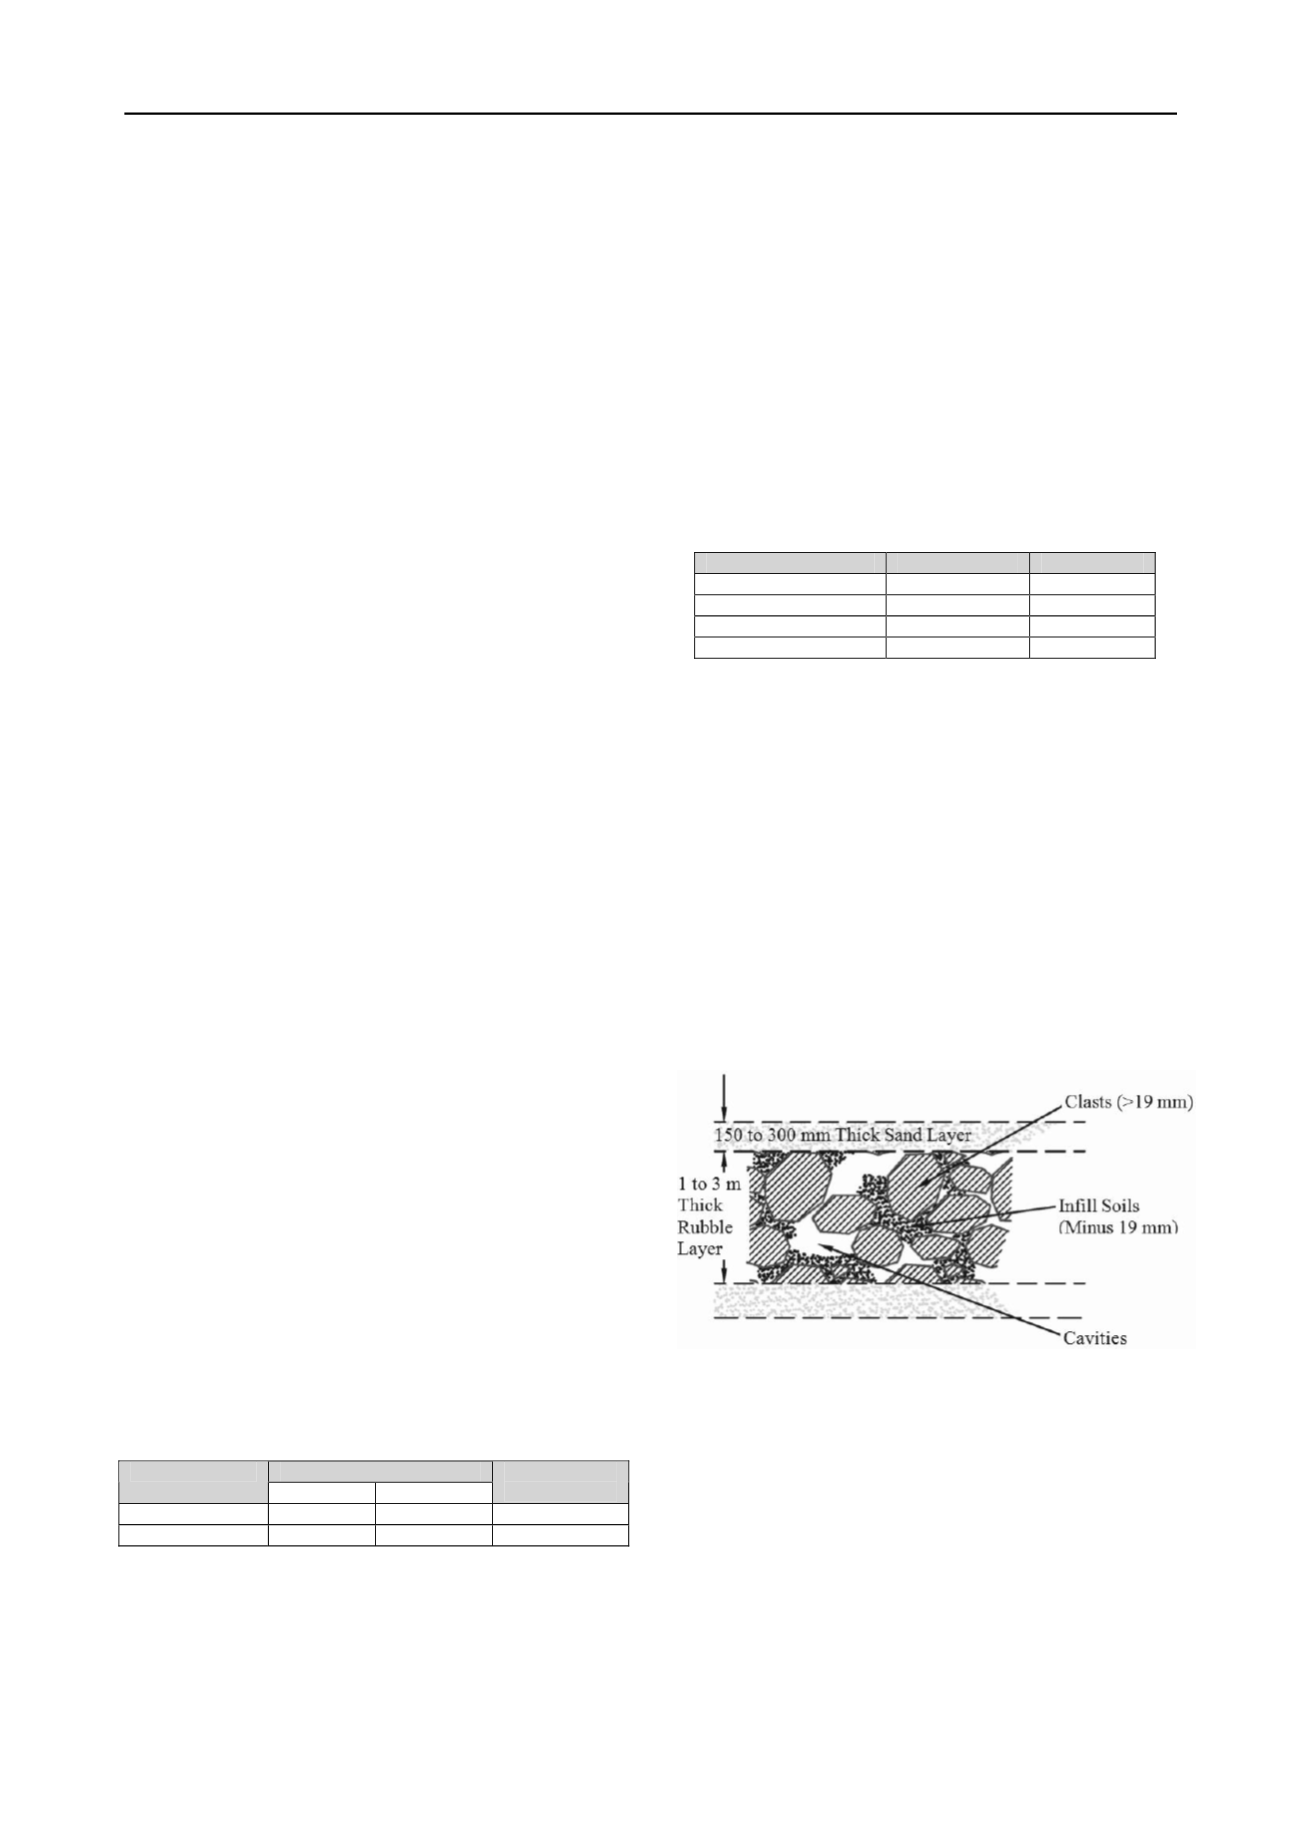
3 SETTLEMENT MODEL
The settlement model used in the analysis considered the
layered nature of the debris fill consisting of a succession of 1 to
3 m thick voided and nested rubble lifts capped by 15 to 30 cm
thick loose to medium dense soil lifts. The total debris fill may
be considered to consist of nested oversize clasts (defined as
materials lager than 19 mm for purposes of this analysis), infill
soils (minus 19 mm fraction that partially fills the cavities
between clasts and also caps individual layers of rubble), and
cavities (Figure 2).
Figure 2. Debris Fill Structure
When subjected to seismic loading and/or saturation due to
groundwater rise, the predominant mechanisms of settlement in
the debris fill are considered to be partial filling of the cavities
by fines migration (cap soils migrating into the underlying
nested rubble), and collapse of the nested structure. Volumetric
compression of the infill soils and soil lifts will also take place,
but they are considered to be significantly smaller than the two
dominant settlement mechanisms. The volume of cavities
between the nested clasts, as a percentage of the total volume of
fill, will, therefore, form an upper bound of the potential
volumetric strain / settlement of the fill. The volume of cavities
in the fill (Figure 2) as a ratio of the total fill volume, was
estimated as shown below, based on the void ratio of the entire
debris fill, e
t
(calculated from large diameter ring density tests),
void ratio of the infill soils, e
s
(calculated from the sand cone
density tests), the ratio of weight of clasts to weight of infill


