617
Technical Committee 102 /
Comité technique 102
Proceedings of the 18
th
International Conference on Soil Mechanics and Geotechnical Engineering, Paris 2013
homogeneity of the subsoil under the Barrette base and the good
quality of their production.
4.2 Test of the middle parts of barrettes B1...B5.
At the end of the first stage of testing bottom level jacks are
retracted, and their hydraulic system is open. In this
configuration, the lower level of jacks do not transfer the load
from a upper jacks level on the base. In this case, loading of the
upper jack level resisted only by shaft resistance of the middle
barrette part, allowing to accurately determine shaft friction
value.
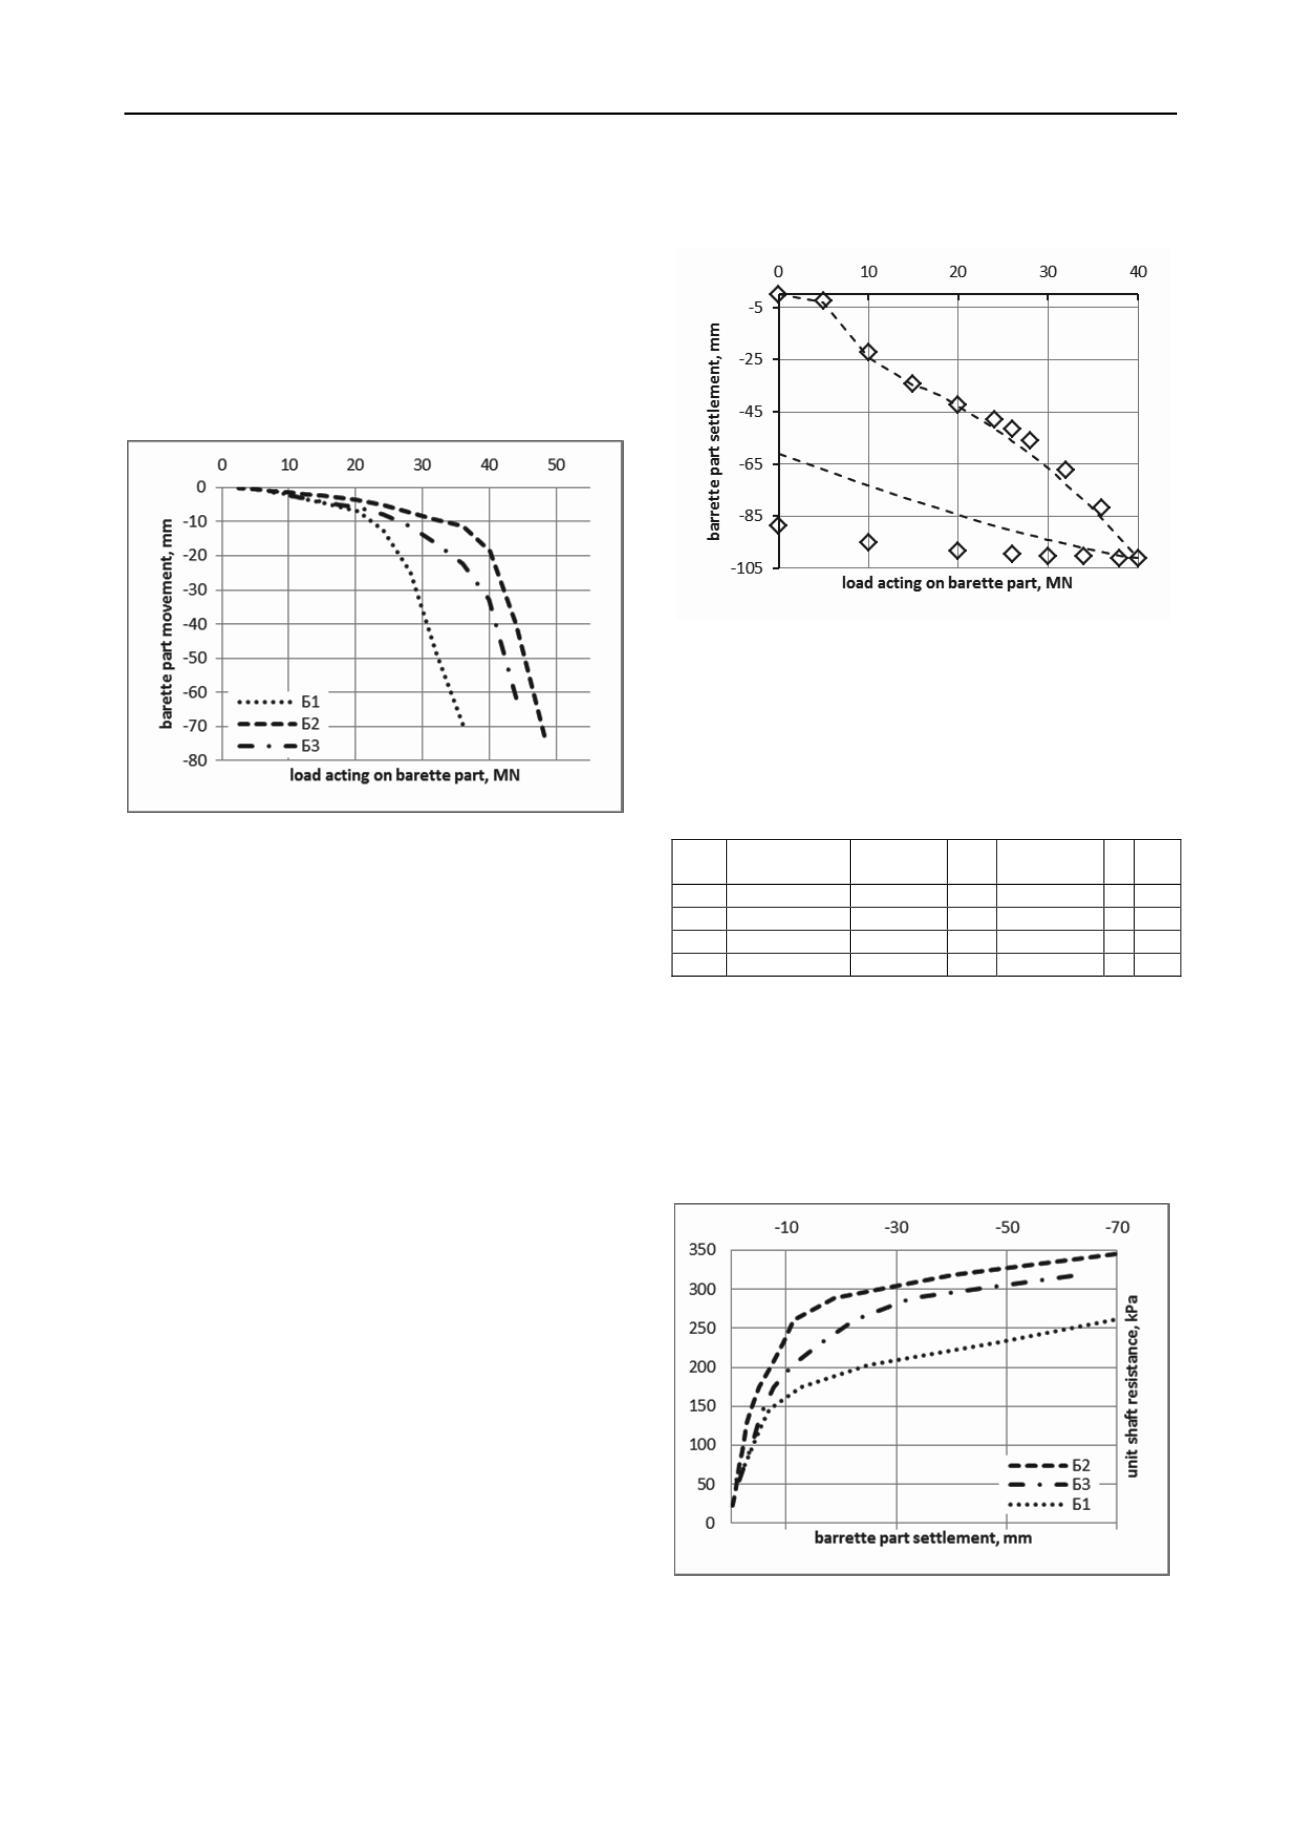
Figure 4. Stage 2 test results.
Compared with the test of the first stage (lower jack level)
results show significantly greater variation in the ultimate shaft
friction values. Load-settlement curves for the second-stage
tests are shown in Fig. 4.
Load-settlement curves shown on Fig. 3 characterized by
initial almost flat part, with a slightly longer length for Barrette
B2. The angle of the load-settlement curves for B1 and B3
began to increase after the load value of 20 ... 25 MN, and for
B3 35 MN.
The presence of a longer horizontal part on load-settlement
curve for B2 may be due to heterogeneity of soil conditions
along the tested barrette part, or, more likely, due to its central
position in the group.
4.3 Back-analysis of test results performed by FEM.
One of the most effective tools for the analysis of load test
made by the Osterberg scheme is the reverse calculation method
with regard to elastic-plastic soil properties by means of FEM.
The reverse calculation has several objectives: 1) Calibration
of design parameters of adopted soil model 2) evaluation of the
bearing capacity of single pile in the top down loading
conditions 3) assessment of the applicability and adequacy of
the chosen soil model.
The starting point for the reverse calculations is the soil
properties obtained by laboratory testing. By varying individual
soil model parameters one can identify the most important of
them, and then achieve convergence between experimental and
calculated results.
The first iteration of calculation based on laboratory
determined soil properties showed that the calculated values of
barrete upward movement is 6 times larger than the
experimental values, and downward movement is overestimated
by 2 times. This suggests that the characteristics of soils,
provided through laboratory testing are very different from the
characteristics of the soil in-situ.
Taking into account observed discrepancy the objective was
to find such soil characteristics, which would have shown the
best convergence of calculation with the experiment. Barrette
movement and stress along its body were chosen as
convergence criteria between the experimental and calculated
values.
Figure 5. Comparative charts of data obtained from the
experiment and the results of the calculation.
Comparison of modeling results with the experimental data
shown in Figure 4. The graph shows the results of calculations
with adjusted characteristics of soil is almost equal to the results
of the test. It should be noted that non-compliance of Barrette
behavior during unloading caused by incorrect rapid unloading
procedure.
Table 1.Adjusted by FEM calculations soil properties.
GE
number
Soil
classification
Density,
g/cm
3
Е,
MPa
Poisson ratio
ν
φ,
°
С,
kPa
11
Hard clay
21.3
50
0.25
17 150
12
Hard clay
22.2
200
0.2
25 330
12а
Hard clay
21.1
105
0.22
18 200
13
Hard clay
22.3
252
0.18
27 491
5 COMPARISON OF OBTAINED SHAFT UNIT
FRICTION WITH BASIC CALCULATION METHOD
RESULTS.
The main purpose of the second phase of the test was to
determine the specific shaft resistance values for middle parts of
Barrette B1 ... B3. Resistance value is determined by dividing
the applied load on the shaft surface area of the middle part of
barrette.
Figure 6. Shaft friction-movement curves.
As can be seen from Fig. 5, for barrette movements of up to
20 mm shaft friction increasing drastically to 190 ... 290 kPa. A
further increase in displacement to 60 mm results in a small
(about 60 kPa) monotonic increment of resistance. The peak
(maximum) value of the shaft resistance was not clearly


