625
Technical Committee 102 /
Comité technique 102
4 DRILLING AND IN-SITU TESTING
Drilling for the Supplementary Soil investigations was carried
out from five drilling barges equipped with suspended rotary
top drive drilling rigs and passive heave compensation.
Three different passive heave compensation systems were
installed on the five drilling barges used for the investigations:
A strictly mechanical weight load system on one barge,
A spring loaded mechanical system on three barges, and
A hydraulic piston system on one barge.
The above mentioned systems were able to be operated with
good results (in terms of heave compensation) at maximum
heave of approx. 0.7 to 1.0 m.
Undisturbed samples (fine grained soils) were primarily re-
trieved with a 76 mm diameter thin walled stationary piston
sampler with stainless steel seamless sampling tubes of length
1.0 m.
Undisturbed samples were sealed with wax and taped-shut
end caps immediately after retrieval. Storage and transportation
were carried out vertically in wooden boxes filled with shock
absorbing material (coarse sawdust).
SPT testing in coarse grained soils was generally carried out
at 1.5 m intervals, and the hydraulic head in the boreholes was
as a minimum kept at a level corresponding to sea level. The
SPT-N Energy Transfer Ratio (ETR) was determined by carry-
ing out PDA tests of the equipment used from three different
barges.
In situ shear vane testing was performed at 1 m intervals in
fine grained soils using the Chinese electrical vane equipment
with cruciform vanes of dimensions 75 mm x 150 mm for the
softer clays.
CPTU testing was carried out using underwater seabed pie-
zocone penetration systems deployed from barges where the po-
sition was maintained by means of 4 heavy anchors. Two dif-
ferent CPTU systems were used, the Wheeldrive Seacalf with
200 kN thrust and the ROSON system with a 100 kN thrust. All
CPTU testing was carried out in accordance with the ISSMGE
(2001) standard.
5 LABORATORY TESTING
Classification testing for the Supplementary Soil investigations
consisted of natural moisture content, bulk and dry density, par-
ticle density, Atterberg limits, particle size distributions, maxi-
mum and minimum dry densities and organic content.
Incremental loading (IL) oedometer testing was carried out on
both undisturbed fine grained soil samples and reconstituted
coarse grained soil samples in accordance with BSI (1990a).
The specific schedule for the IL oedometer tests on fine
grained samples was designed to take into account the in-situ
and pre-consolidation stress together with the anticipated stress
history imposed by the construction activities.
The maximum net stress increments under the tunnel ele-
ments were not expected to lead to exceedance of the in-situ
stresses neither along the middle part of the immersed tunnel
alignment nor towards the artificial islands.
In view of the above, special attention was paid to determine
reliable estimates of the values of the pre-consolidation stress
and the reloading stiffness. The IL oedometer tests carried out
on fine grained samples were performed in two batches:
Batch I IL oedometer tests: Mainly carried out to provide an
estimate of the pre-consolidation pressure (and the virgin
compression index),
Batch II IL oedometer tests: Carried out to provide an esti-
mate of the reloading stiffness from varying unloading
stress levels below the pre-consolidation stress estimated
from the Batch I tests.
Initial unloading/reloading steps from/to the presumed in-situ
stress were included for both the Batch I and II IL oedometer
tests in an attempt to quantify and reduce the sample distur-
bance resulting from sample retrieval, transportation and extru-
sion. The application of the this initial branch of unload-
ing/reloading conceivably improved the apparent sample quality
significantly, as e.g. evaluated in accordance with NORSOK
(2004), on average from poor to very good/excellent sample
quality.
Triaxial testing of fine grained undisturbed samples was car-
ried out as Consolidated Anisotropic Undrained (CAU) triaxial
tests in accordance with BS1(1990b).
The triaxial tests allowed for site specific calibration of the
N
kt
cone factor for determination of realistic undrained shear
strengths based on CPTUs. Secondly, they allowed the value of
s
u
/σ'
pc
for the normally consolidated condition (often referred to
as the c/p ratio) to be determined. In this way a site specific
SHANSEP relation could be established allowing determination
of the undrained shear strength variation from actual unload-
ing/reloading cycles as a consequence of construction activities.
6 CPTU CORRELATIONS
For the purpose of establishing a detailed geological and geo-
technical model of the subsurface conditions, a combination of
cored boreholes and closely spaced CPTU soundings was se-
lected as the primary method of investigating the project site.
The CPTUs and boreholes were generally carried out as de-
scribed. The locations of the boreholes were arranged to provide
a total of 68 Nos. pairs of boreholes and CPTUs along the
alignment. This allowed for a site specific correlation between
the stratigraphy as encountered within the boreholes and the
corresponding principal CPTU properties with respect to cone
resistance, friction ratio and pore pressure. The boreholes and
CPTUs carried out in pairs were generally positioned within a 5
m distance from each other.
Initially, two approaches were investigated to find the most
appropriate correlation model for the site investigation data,
namely a conventional method developed by Robertson et al
(Lunne et al 1997) and a site specific approach based on pairing
the CPTU and borehole data.
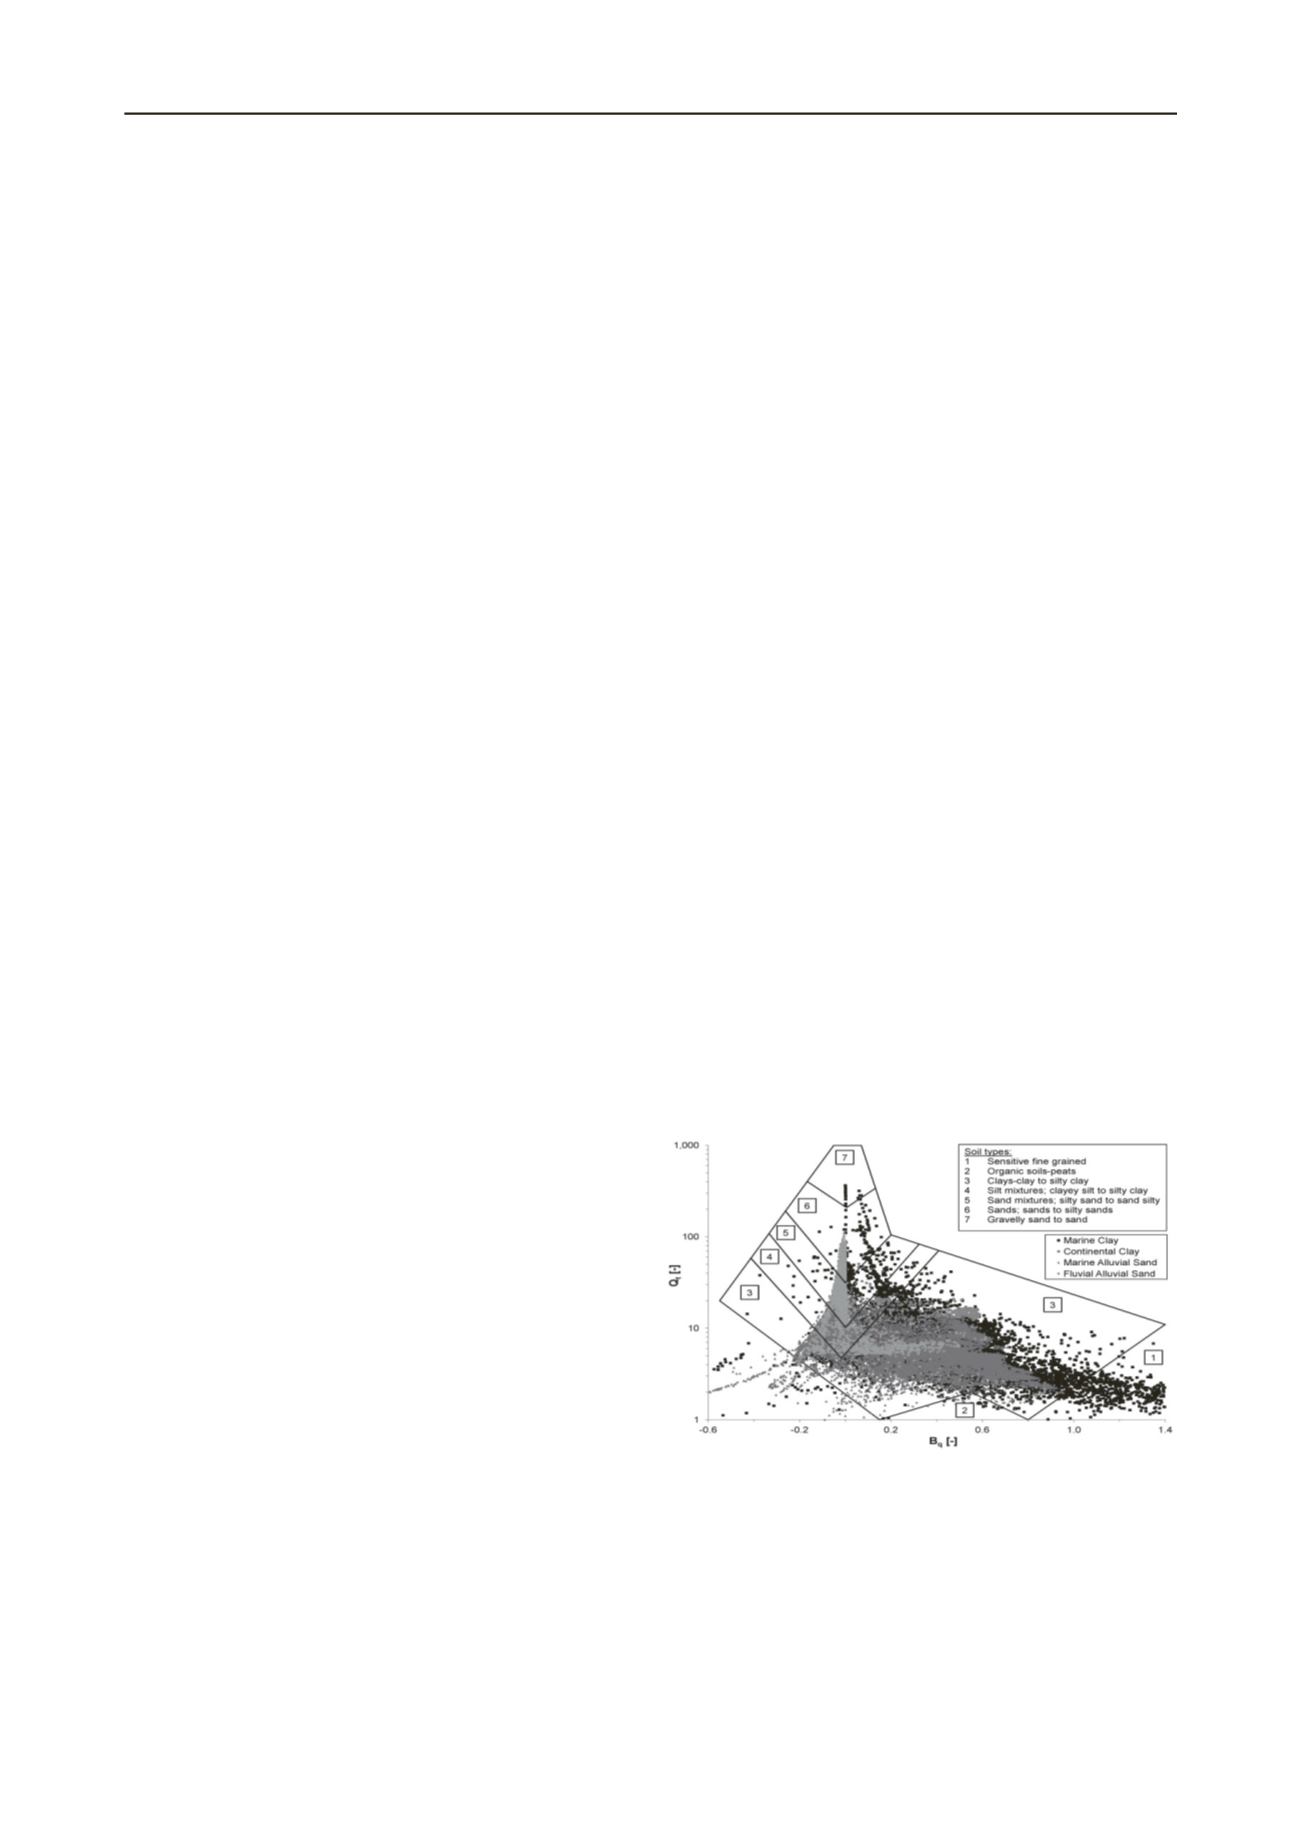
The depiction of the site CPTU results categorised into the
different main geological units and using the Robertson classi-
fication chart is shown in Figure 4.
Figure 4. CPTU results superposed on soils classification chart (Lunne
et al 1997)
.
Instead, the CPTU data were analysed statistically, yielding rep-
resentative ranges and frequency distributions of each geo-
logical unit with respect to cone resistance, friction ratio and
excess pore pressure. In this way a unique "foot print" was pro-
duced for each geological unit as e.g. shown in Figure 5.


