634
Proceedings of the 18
th
International Conference on Soil Mechanics and Geotechnical Engineering, Paris 2013
35.3
log 8870 .0
1539 .0
c
f
q
R
x
(1)
37.0
log 4617 .0
2957 .0
c
f
q
R
y
(2)
The soil classification index (
U
) and in-situ behavior index
(
V
) are given as:
2
2
1 2
2
1
2 1
1
2 1 1 2 1
d yc xc
d yc xc
d yc xcb ya xa
U
2
2
1 2
2
1
2 1
2
1 2 2 1 2
d yc xc
d yc xc
d yc xc b ya xa
(3)
2
2
1 2
2
1
2 1
2 1 2 1
2 1
)
( )
(
)
)(
(
10
d yc xc
d yc xc
b ya xa d yc xc
V
2
2
1 2
2
1
2 1
2
1 2 1 2 1
)
( )
(
)
)(
(
d yc xc
d yc xc
d yc xc b ya xa
(4)
The coefficients in equations 3 and 4 are defined as: a
1
=-11.345,
a
2
=-3.795, b
1
=15.202, b
2
=5.085, c
1
=-0.269, c
2
=-0.759,
d
1
=-2.960 and d
2
=2.477.
A statistical correlation was then established between the
U
index and the compositional soil type given by the Unified Soil
Classification System (USCS) (ASTM D2487-11). A normal
distribution of
U
was established for each reference USCS soil
type (GP, SP, SM, SC, ML, CL, and CH). Each
U
value
corresponds to several soil types with different probabilities.
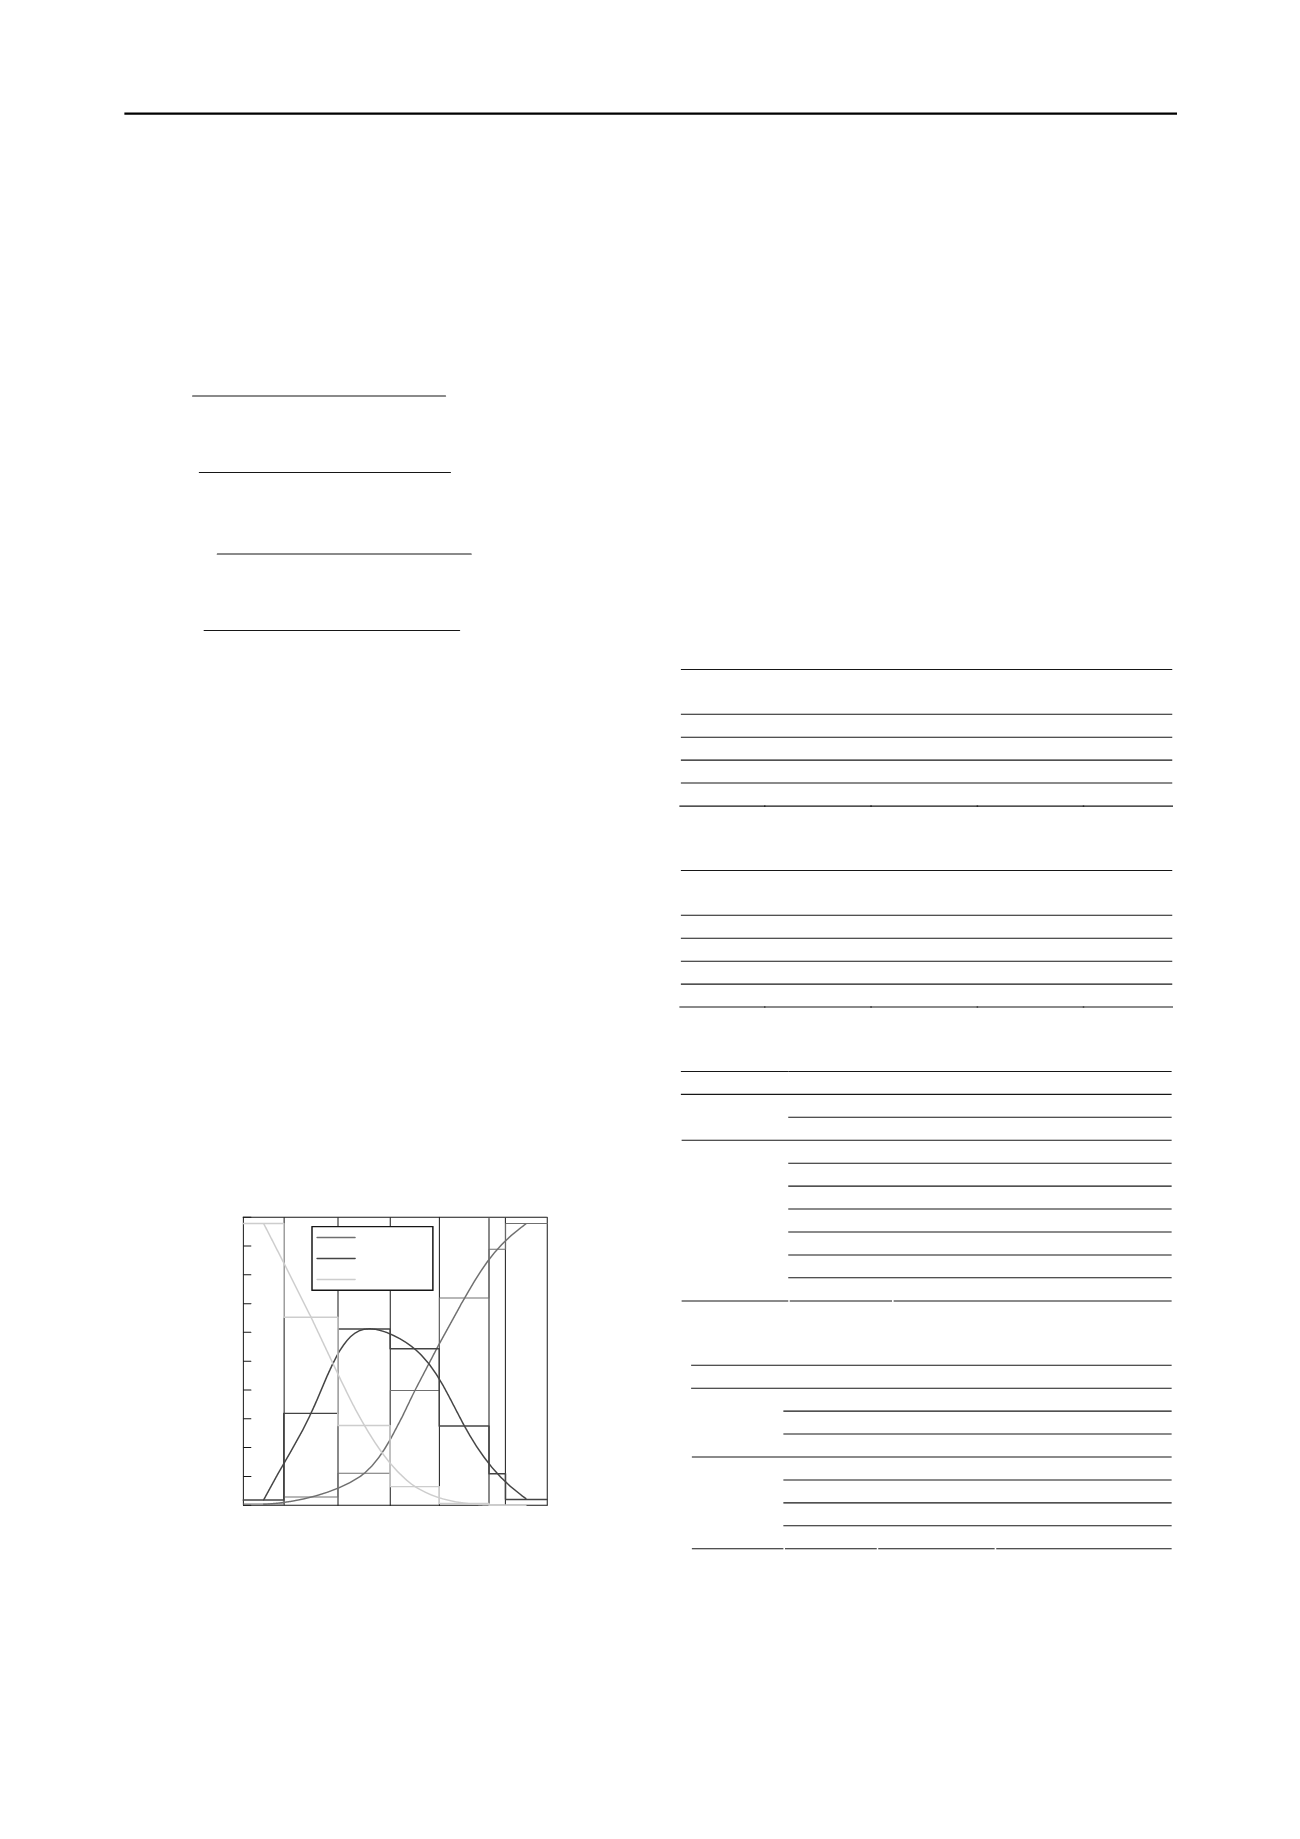
Boundary values were used to divide the U axis into seven
regions as described in Figure 1.
Soil types were further rearranged into three groups: sandy
and gravelly soils (GP, SP, and SM), silty soils (SC and ML)
and clayey soils (CL and CH). Figure 1 also gives the
probability of having each soil group within each region. The
original method gives constant probability of each soil type
(represented by the step lines) regardless of the
U
value within
the same region (R1 to R7 in Figure 1). This allows for the
sudden drop in the probabilities as the
U
value crosses the
border from one region to another. This method was further
modified to allow smooth transition of probability (curved
lines) with
U
values, and hence to provide a continuous profile
of the probability of soil constituents with depth.
U Value
0
10
20
30
40
50
60
70
80
90
100
Probability (%)
R 7
R 6
R 5
R 4
R 3 R 2 R 1
-0.14 0.61 1.33 2.01 2.7 2.91
GS, SP, SM
SC, ML
CL, CH
Figure 1. Regional boundaries and the corresponding probabilities of
each soil group.
In-situ behavior index (
V
) provides a profile of soil behavior
and, in combination with the compositional soil classification
index (
U
), estimates of soil organic content and of soil
rigidity/stiffness (indirectly OCR) can be determined (Tümay
et.al, 2012).
3 ORGANIC MATERIAL PROFILING
The proposed profiling method utilizes a combination of the soil
classification index and the in-situ behavior index values where
the [(
V
-
U
) > 3.0] indicates significant organic content. The
organic content indicator (
V-U
) makes it possible to profile the
changes in organic content continuously while acknowledging
the likelihood of having organic material in any given soil
composition.
To illustrate the proposed method, two well documented
data sets from the Mississippi River Long Distance Sediment
Pipeline study located near Barataria Waterway in Jefferson
Parish, Louisiana are considered. Tables 1, 2, and 3 present the
laboratory test results for data sets B-7 and B-28 including
moisture content percentage (ASTM D2216-10), Atterberg
Limits (ASTM D4318-10), and material content finer than No.
200 sieve (ASTM D1140-06). Table 4 presents the organic
content percentages (ASTM D2974-07) for the same data sets.
Table 1. Laboratory testing values for B-7 data set.
Depth
(m)
Moisture
Content %
Liquid
Limit %
Plastic
Limit %
Plasticity
Index %
1.2
125
133
35
98
3.0
42
38
22
16
4.9
93
99
32
67
9.1
74
85
27
58
Table 2. Laboratory testing values for B-28 data set.
Depth
(m)
Moisture
Content %
Liquid
Limit %
Plastic
Limit %
Plasticity
Index %
2.1
72
44
20
24
2.8
81
78
24
54
4.3
80
86
28
58
16.8
50
69
23
46
Table 3. Material passing No. 200 sieve for B-7 and B-28 data sets.
Data Set
Depth (m)
Material Passing No.200 Sieve %
1.2
89
B-7
9.1
100
2.1
96
3.7
27
4.2
98
6.1
87
8.8
27
10.7
12
B-28
16.5
100
Table 4. Organic content values for B-7 and B-28 data sets.
Data Set
Depth (m) Ash Content % Organic Content %
0.6-0.9
85.42
14.58
1.8-2.1
96.85
3.15
B-7
3.0-3.4
96.85
3.15
0.6-1.2
85.95
14.05
2.4-2.8
84.78
5.22
3.7-4.0
91.73
8.27
B-28
7.2-7.6
97.10
2.90
Figures 2 and 3 illustrate the CPT sounding values (
q
c
, f
s
and
R
f
) (ASTM D 5778-12), Zhang and Tumay (1999) probabilistic
soil classification soil results with
U
and
V
index values,
organic content indicator (
V-U
), and corresponding lithology
obtained from the boring logs for B-7 and B-28 data sets.


