635
Technical Committee 102 /
Comité technique 102
% Clay
% Silt
% Sand
0.0
2.0
4.0
6.0
8.0
10.0
12.0
14.0
16.0
18.0
0.00 1.00 2.00
DEPTH (m)
MPa
TIP RESISTANCE (qc)
0.0
2.0
4.0
6.0
8.0
10.0
12.0
14.0
16.0
18.0
0.00 0.02 0.04
MPa
SLEEVE FRICTION (fs)
0.0
2.0
4.0
6.0
8.0
10.0
12.0
14.0
16.0
18.0
0.00 10.00 20.00
%
FRICTION RATIO (Rf)
0.0
2.0
4.0
6.0
8.0
10.0
12.0
14.0
16.0
18.0
-5.0 0.0 5.0
U INDEX
0.0
2.0
4.0
6.0
8.0
10.0
12.0
14.0
16.0
18.0
0.0 2.0 4.0
V INDEX
0.0
2.0
4.0
6.0
8.0
10.0
12.0
14.0
16.0
18.0
-3.0 3.0 9.0
Inorganic | Organic
Organic Content (V-U)
0.0
2.0
4.0
6.0
8.0
10.0
12.0
14.0
16.0
18.0
%0 %50 %100
ZT99 Probabilistic
0.0
2.0
4.0
6.0
8.0
10.0
12.0
14.0
16.0
18.0
%0 %50 %100
Lithology
ORGANIC CLAY (OH)
,
very soft,black
LEAN CLAY (CL)
,very
soft to soft,gray and
darkgray
FAT CLAY (CH)
,
very soft,dark
gray
LEAN CLAY (CL)
,very
soft,gray,with shell
fragments, andsand
FAT CLAY (CH)
,
soft,gray,with silt
seams
and lenses
FAT CLAY (CH)
,
soft to firm,gray,
with silt
seamsand lenses
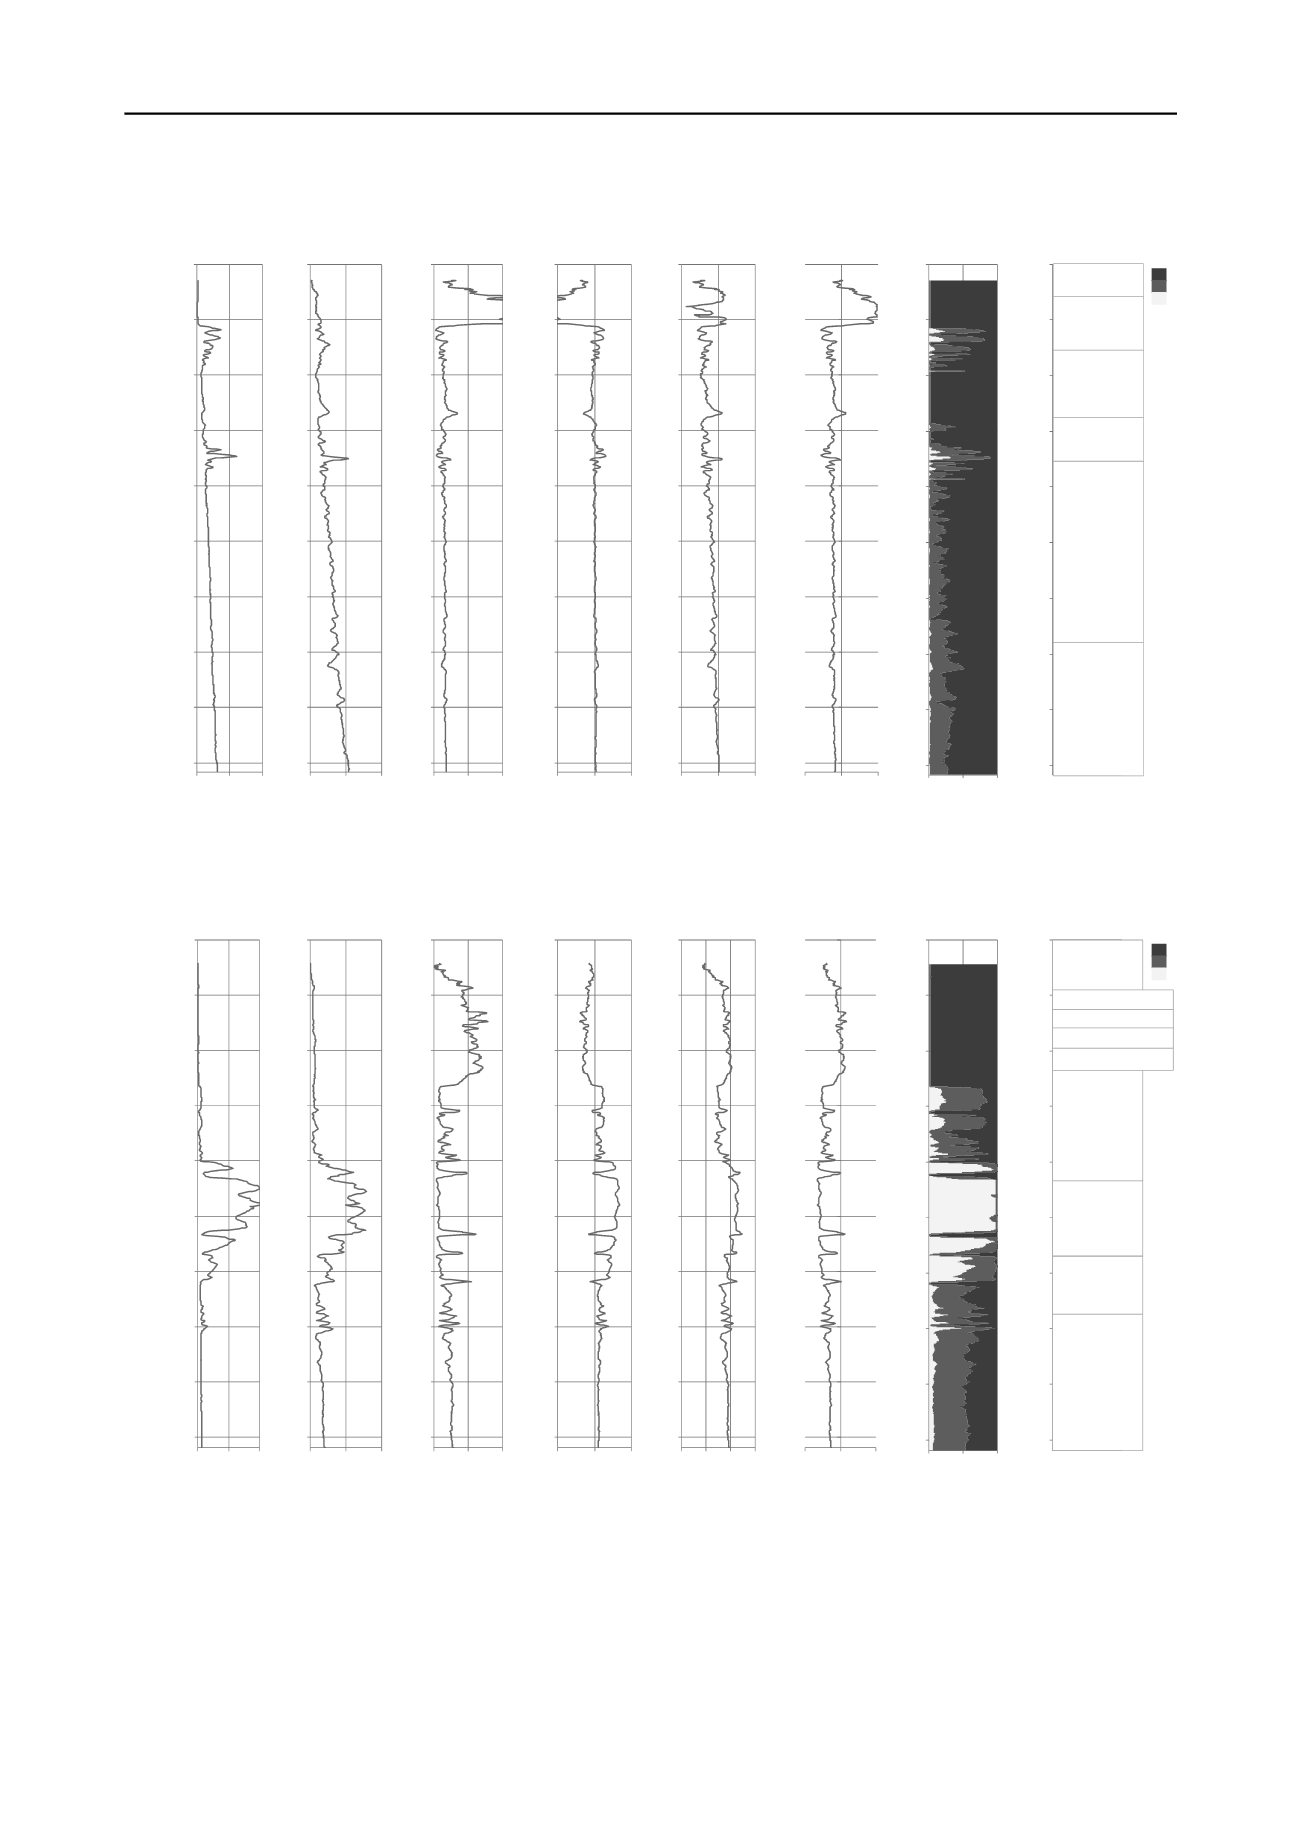
Figure 2. CPT-Based organic material profile and lithology – B-7 Data Set.
% Clay
% Silt
% Sand
0.0
2.0
4.0
6.0
8.0
10.0
12.0
14.0
16.0
18.0
0.00 6.00 12.00
DEPTH (m)
MPa
TIP RESISTANCE (qc)
0.0
2.0
4.0
6.0
8.0
10.0
12.0
14.0
16.0
18.0
0.00 0.05 0.10
MPa
SLEEVE FRICTION (fs)
0.0
2.0
4.0
6.0
8.0
10.0
12.0
14.0
16.0
18.0
0.00 5.00 10.00
%
FRICTION RATIO (Rf)
0.0
2.0
4.0
6.0
8.0
10.0
12.0
14.0
16.0
18.0
-5.0 0.0 5.0
U INDEX
0.0
2.0
4.0
6.0
8.0
10.0
12.0
14.0
16.0
18.0
-2.0 0.0 2.0 4.0
V INDEX
0.0
2.0
4.0
6.0
8.0
10.0
12.0
14.0
16.0
18.0
-3.00 3.00 9.00
Inorganic | Organic
Organic Content (V-U)
0.0
2.0
4.0
6.0
8.0
10.0
12.0
14.0
16.0
18.0
%0 %50 %100
ZT99 Probabilistic
0.0
2.0
4.0
6.0
8.0
10.0
12.0
14.0
16.0
18.0
%0 %50 %100
Lithology
ORGANIC CLAY (OH)
,
very soft,dark gray,
with roots,peat, and
shells
FAT CLAY (CH)
,
firm,gray,with
organicsand
roots
LEAN CLAY (CL)
,very
soft,gray
SILTY SAND (SM)
,
very looseto
medium-dense, gray
LEAN CLAY (CL)
,gray
-with sandseams
FAT CLAY (CH),
w/organics
ORGANIC CLAY (OH)
FAT CLAY (CH),
w/organics
LEAN CLAY (CL),
w/organics
Figure 3. CPT-Based organic material profile and lithology – B-28 Data Set.
As illustrated in Figures 2 and 3, the organic content
indicator (
V-U
) identified the significant organic content in the
sample data sets while providing a continuous profile. When
this information is combined with the CPT-based soil
classification, it provides a better understanding of the
subsurface conditions. For example, laboratory testing values
indicate a fine grained soil with high plasticity index (98%) for
the first meter of the B-7 data set where the organic content test
resulted in 14.58%. The test values show a significant drop after
2.0 meters for the plasticity index (16%) and the organic content
(3.15%). This profile change is clearly illustrated in Figure 2.
Similarly, as shown in Figure 3, the test results show organic
content over 5% for the B-28 data set between 2.5 and 4.0
meters. This value decreases to 2.90% at 7.2 meters.


