643
Technical Committee 102 /
Comité technique 102
once, otherwise they could not be regarded as representative
(Zabielska-Adamska 2006). The
CBR
tests were conducted on
unsaturated samples. All the samples subjected to penetration,
tested both methods – static and dynamic, and were loaded with
ASTM 1883-73 recommended load of 2.44 kPa. The static
(classic)
CBR
research was done on fly ash samples directly
after compaction. Higher
CBR
value was accepted as a result
D
50
(mm)
s
(g/cm
3
)
C
U
=
D
60
/
D
10
C
C
=
D
30
2
/
D
60
·
D
10
0.055–0.065
2.11±0.01
3.89–4.25
0.94–1.03
Modified Proctor method
Standard Proctor method
1opt
w
(%)
max1 d
(g/cm
3
)
opt2
w
(%)
max2 d
(g/cm
3
)
37.00
1.068
45.50
1.009
Table 1. Geotechnical parameters of tested fly ash shipment.
Tested fly ash parameters
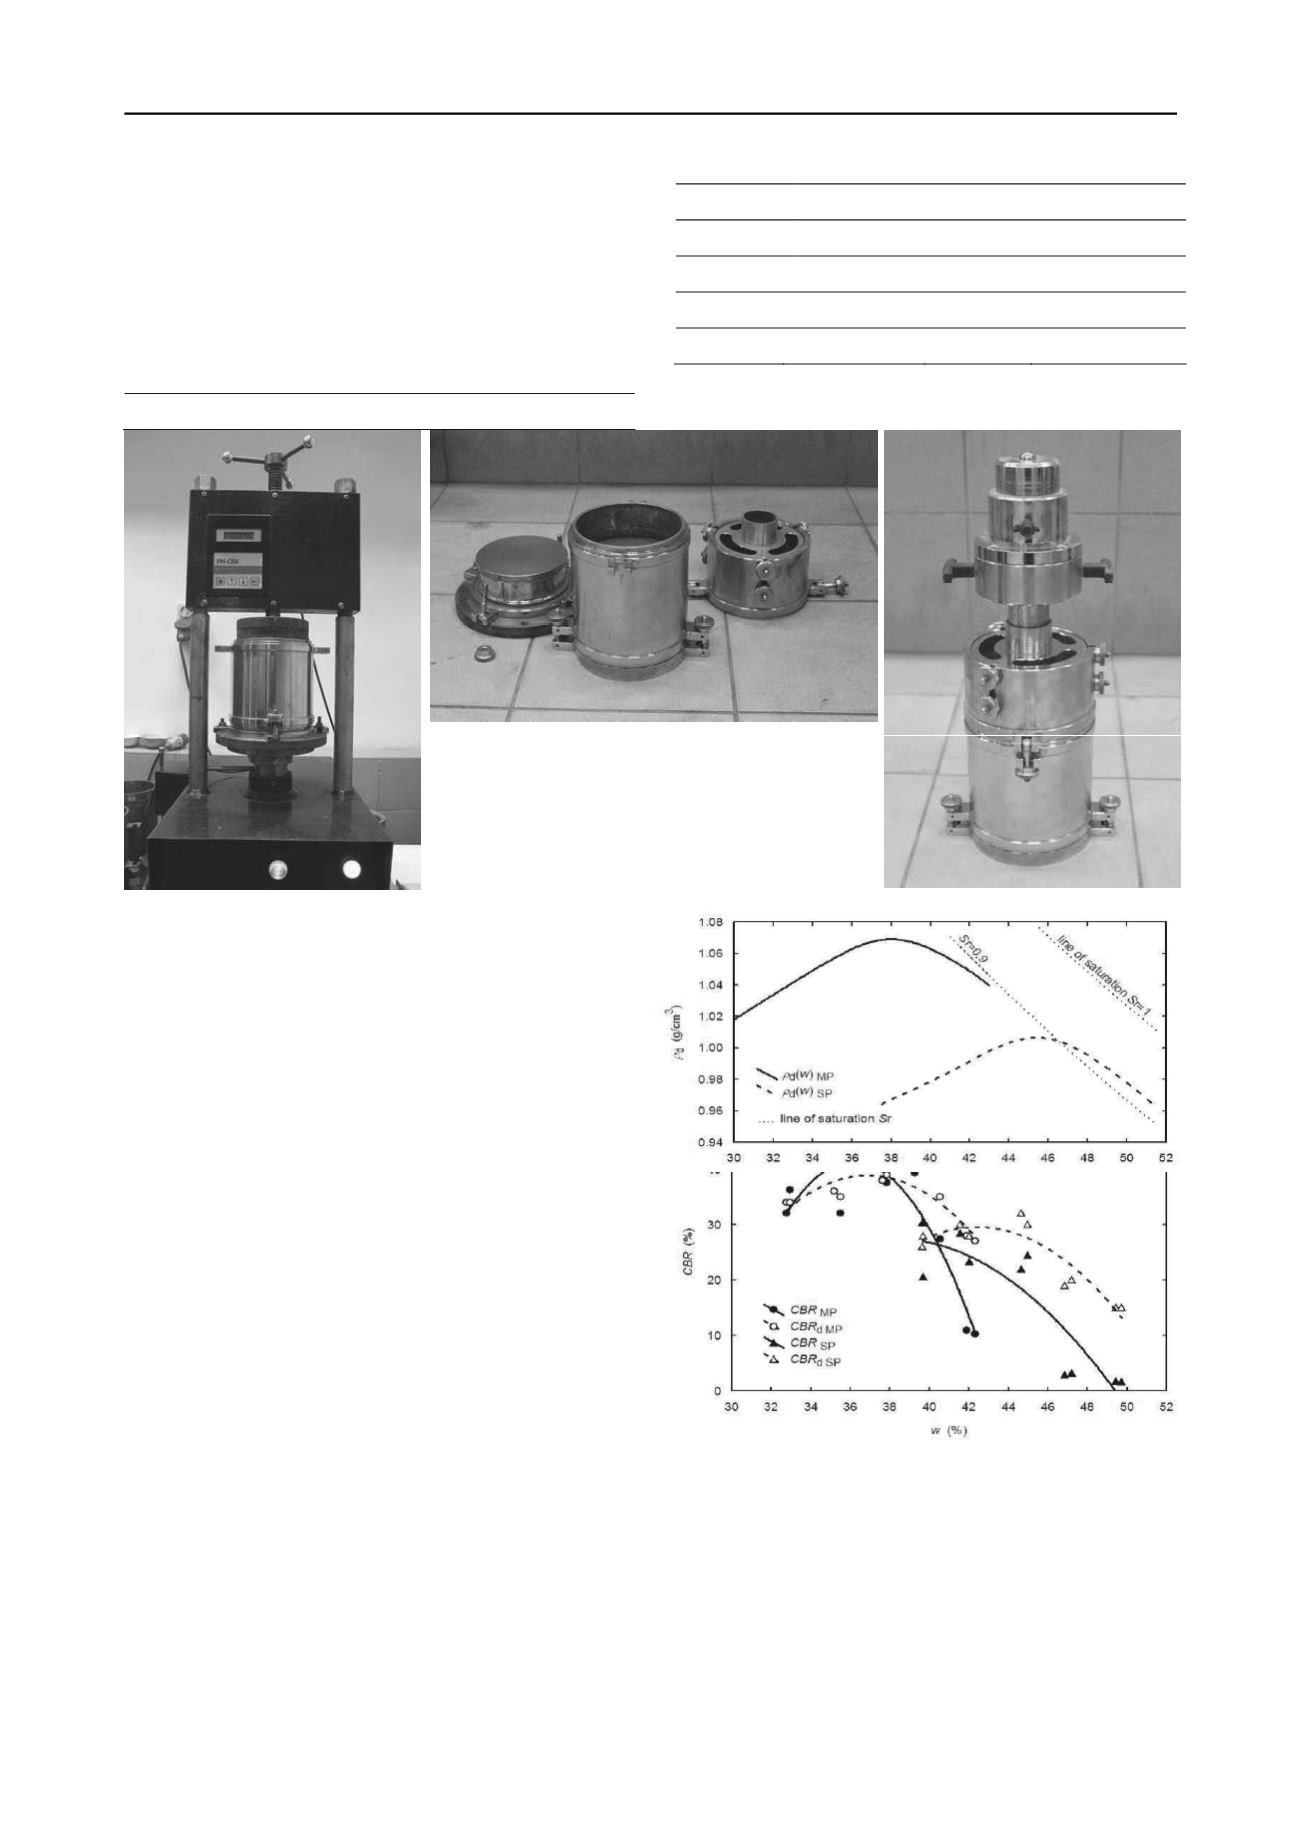
Figure 1.
CBR
research (from the left): static test;
changed mould basis and prepared mould extension for
dynamic
CBR
; specimen ready for dynamic test (photo
by Zabielska-Adamska).
calculated on the basis of pressing piston resistance, represented
in a given depth – 2.5 or 5.0 mm. Next, after levelling off the
surface of the same specimen and replacement of basis of the
mould, dynamic
CBR
was carried out. The
CBR
d
tests were
conducted using Light Weight Deflectometer (LWD) consisting
of a falling weight (7.07 kN) vertically movable along the guide
rod to produce a defined load pulse (3.6 MN/m
2
) of the
CBR
piston. Electronic measurement system gauged the depth of the
piston’s penetration in the tested soil after a single impact.
CBR
tests are shown in Figure 1.
Figure 2 represents the results of standard and dynamic
CBR
testing, depending on moisture content at compaction, in
relation to compaction curves of fly ash, obtained by means of
two Proctor methods. Static
CBR
results confirm earlier results
obtained by the author.
CBR
of unsaturated samples of fly ash
reaches the highest values in the case of samples compacted at
the moisture content lower than optimum. The samples
compacted above optimum water content have still lower
CBR
values simultaneously with an increase of moisture content.
These relationships can be observed in both methods of
compaction – standard method and modified method. However,
samples compacted with the use of modified Proctor method,
the curve
CBR
(
w
) definitely reaches maximum. The shape of
the curves
CBR
d
(
w
) is similar to that obtained according to the
standard method –
CBR
(
w
). In the case of modified compaction,
curves
CBR
d
(
w
) and
CBR
(
w
) are characterised by a similar
scope of moisture content; from
w
opt1
–5% to optimum moisture
content,
w
opt1
(difference in relation to
CBR
– up to about
2.5%). Once curve
CBR
d
(
w
) exceeds
w
opt1,
it also exceeds
standard curve, passing
CBR
by 16% at
w
opt1
+5%. In the case of
standard compaction, at moisture level
w
opt2
–5%,
CBR
d
value
equals
CBR
value. After this, as the moisture content increases
the difference also increases and when the moisture level is
equal to
w
opt2
, the
CBR
difference is exceeded by 5%.
CBR
MP
= –1026.64 + 59.09
w
– 0.82
w
2
CBR
d MP
= – 467.44 + 27.46
w
– 0.37
w
2
CBR
SP
= – 297.17 + 16.96
w
– 0.22
w
2
CBR
d SP
= – 519.42 + 25.88
w
– 0.30
w
2
(
R
2
=0.8751)
(
R
2
=0.7768)
(
R
2
=0.8047)
(
R
2
=0.8468)
Figure 2.
CBR
test results versus moisture content at compaction in
comparison with compaction curves: MP – Modified Proctor method,
SP – Standard Proctor method,
CBR
– static test results,
CBR
d
–
dynamic test results.
With further increase of moisture content, the difference may be
as high as 13%. Significant differences in the results of the
studies carried out by means of static and dynamic methods, at
moisture level exceeding
w
opt
originate from the differences in
speed of loading and lack of possibility of pore pressure


