2093
Technical Committee 207 /
Comité technique 207
The stiffness of facing strongly influences the
characteristics of tensile force distribution, such us the slope of
two lateral segments, the tensile force at the connection with
facing,
N
head
, and the location X
max
of maximum traction,
N
max
.
The highest
N
head
is reached in tests
a
and
e
(PMMA and
PMMA95), with
N
head
gradually decreasing according to the
facing deformability: the lowest values are due to tests with
NET and PMMA25. On other hand, the difference
N
max
-
N
head
,
and consequently the slope of segment in the active zone, is less
for tests with PMMA and PMMA95, gradually increasing with
facing deformability. Finally, X
max
is located closer to the face
in tests with PMMA and PMMA95, while it moves itself from
face using deformable covering (NET and PMMA25).
This means that if a rigid facing prevents the soil behind
the face to dilate, limiting, as previously explained, the face
horizontal displacements. In addition it also reduces the relative
soil-nail displacement in the active zone and the increase of
shear stress mobilized at this interface. On the contrary, to
reduce the face deformation, the nails have to be more stressed
by higher soil pressure acting at the rear of facing, because the
soil could not reach the active state condition with the
mobilization of the minimum horizontal stress.
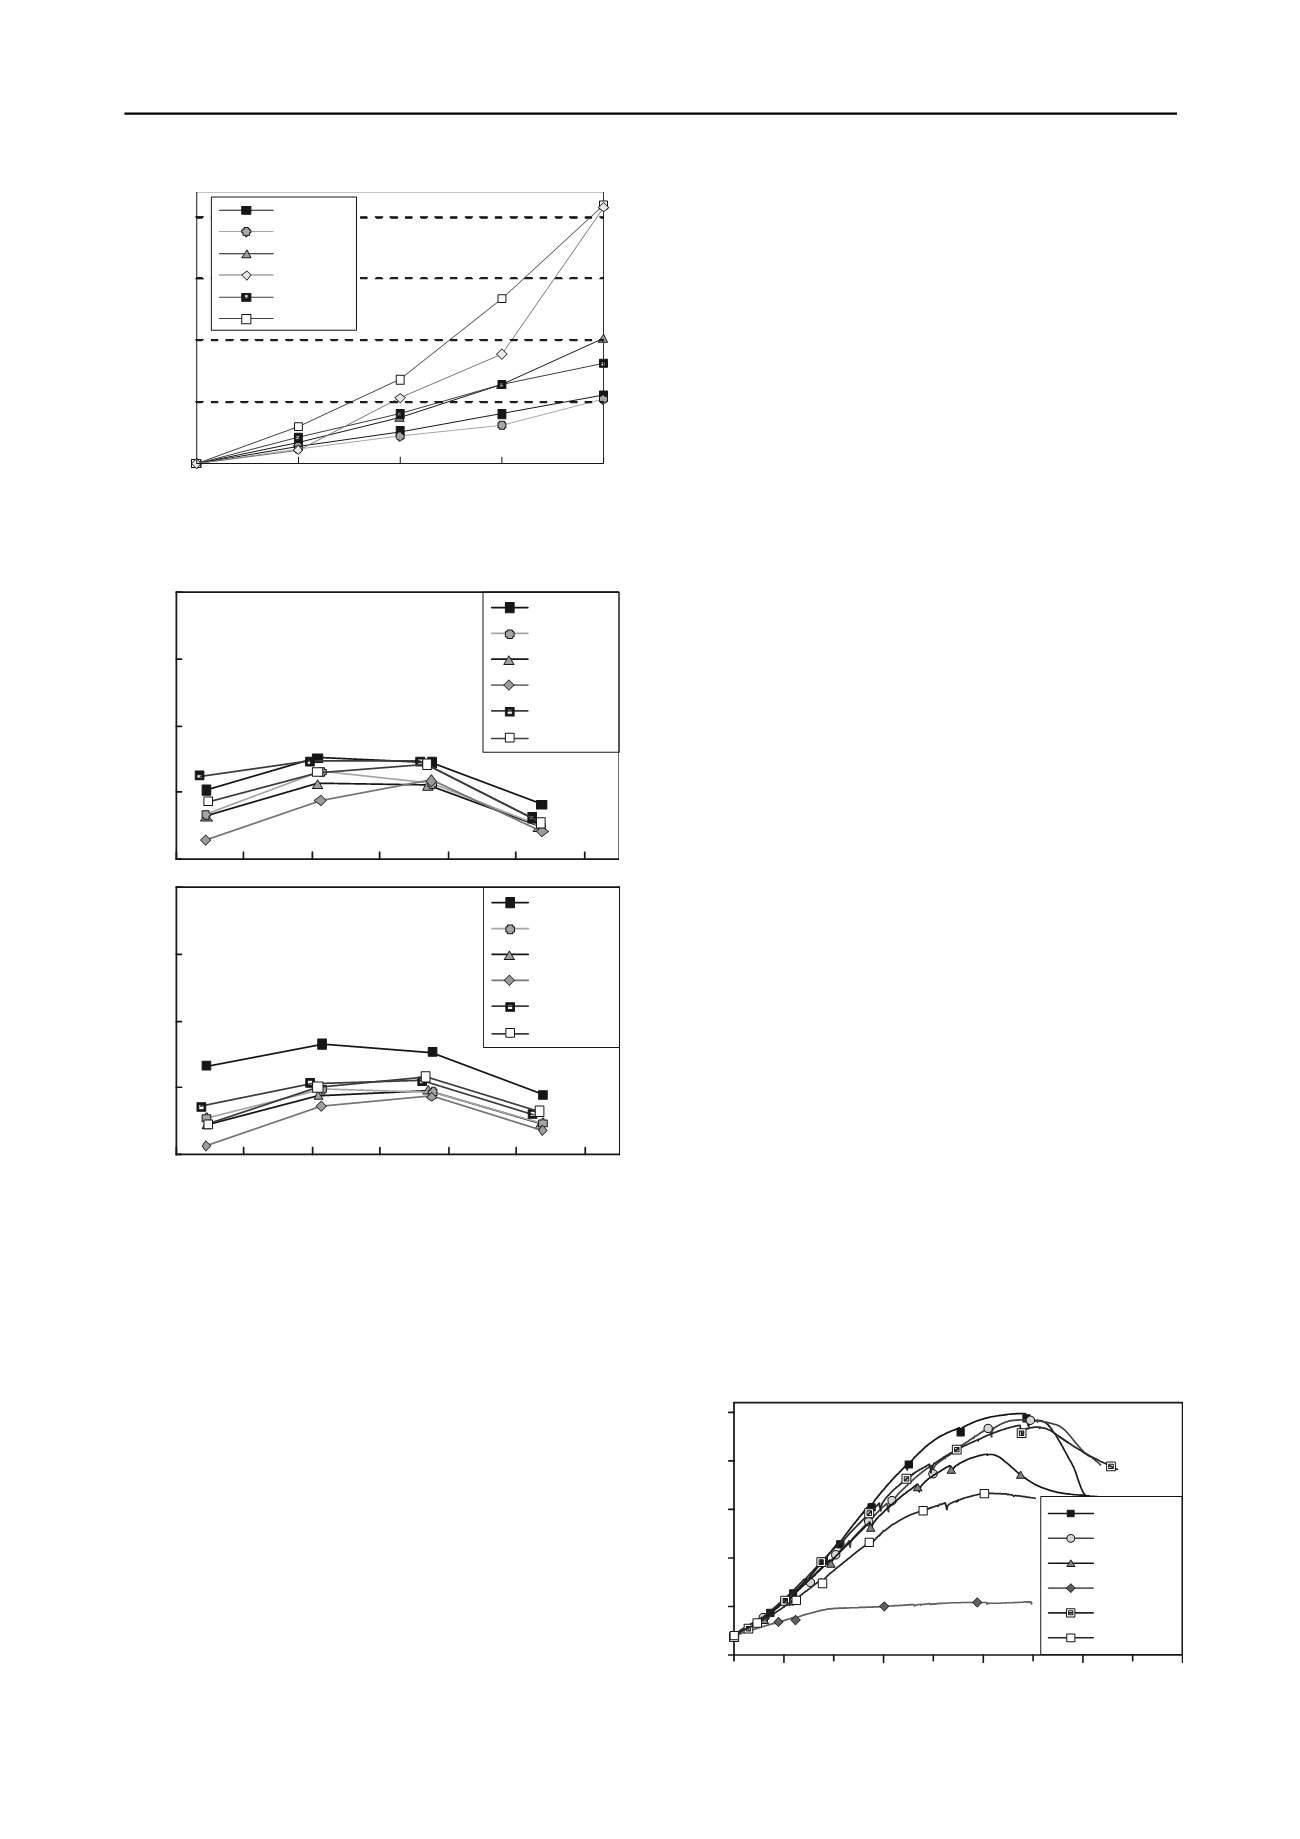
4 MODEL RESPONSE DURING PLATE LOADING
Figure 4 plots the load applied to the plate during the phase
c
vs. the mean vertical displacements of the plate. Temporary
reductions of the load are evident in the graph and they are due
to the temporary stops of loading piston for performing the laser
scanner of the front.
Figure 5 compares the spatial distribution of the
cumulated shear strains at collapse in tests with PMMA, NET
and PMMA25 (for brevity we choose only the most meaningful
images): the shear strain distribution is determined by applying
the PIV analysis to the lateral images of models.
1
2
3
Excavation step number
In all the model tests, failure appears to be combined with
localization of shear strain along one or more narrow bands.
The mostly well-defined band moves from the plate edge (the
one opposite to the face) towards the face base intercepting all
the nails and delimiting the wedge pushing on facing: the wedge
is characterized by a size related with the maximum load
reached in the test: the greater is the maximum load, the larger
is the wedge. Other bands, less clear, individuate a wedge like
those that typically form below shallow foundations.
4
0.0
0.5
1.0
1.5
2.0
Mean plate settlement
y
p
, mm
a
: PMMA
b
: MESH
c
: BRASS
d
: NET
e
: PMMA95
f
: PMMA25
Figure 2. Average plate vertical displacement during four excavation
steps in all the tests.
Figure 6 plots the distribution of tensile force along the
monitored nails when a load of 5,45 kN is applied on the plate:
note that at this load level the model
d
is approaching the
collapse, and some problems affect the strain-gauge readings
(localization of plastic strain in nail n.1 and detachment of one
strain-gauge in nail n.2) and the correct evaluation of tension
value. Moreover, data from test PMMA95 are not reported in
Figure 6, because some problems occurred in the electrical
connections induce to consider them not reliable.
These results permit to point out the important role played
by the facing. The maximum load supported by the retaining
system with rigid facing PMMA,
P
max,a
, is about five time
greater than the load supported in test with NET,
P
max,d
, that
represents the minimum load measured in all the tests. Other
models support loads in the range 0.83-0.97
P
max,a
with higher
values in tests with MESH and PMMA95, the most rigid
covers.
From the comparison suggested in Figure 6 it is evident
that the collapse of model
d
is due to the overcoming of the
pull-out resistance in the passive zone of soils. The relative soil-
nail displacements, cumulated in the active zone as consequence
of facing buckling, induced the increase of tensile gradient in
the section of nails close to the face. Consequently, also the
maximum traction increases significantly:
N
max
in test
d
is 3-4
times greater than that determined in all other tests. This high
tensile force has to be compensated by the frictional resistance
along the nails in the passive zone. This is evident from Figure
6, because the slopes of the tensile profile in the most internal
part of the nails are greater than those characterizing the results
PMMA
MESH
BRASS
NET
PMMA95
PMMA25
0
100
200
300
0
40
80
120
160
Nail tensile force, N
End of excavation - Nail 1
PMMA
MESH
BRASS
NET
PMMA95
PMMA25
0
100
200
Distance
300
from facing, mm
0
40
80
120
160
Nail tensile force, N
End of excavation - Nail 2
Figure 3. Distribution of tensile force along the monitored nails at the
end of excavation: (a) upper nail; (b) lower nail.
0
5
10
15
20
25
Load, kN
PMMA
MESH
BRASS
NET
PMMA95
PMMA25
0
4
8
12
16
Average vertical displacement, mm
Figure 4. Load on the plate vs. mean settlements during loading phase
up to collapse.


