3307
Technical Committee 210 + 201 /
Comité technique 210 + 201
1.2, 2.4, 3.6, 4.8 and 6 days for drawdown rate R = 1.0 m/d and
t = 12, 24, 36, 48 and 60 days for drawdown rate R = 0.1 m/d).
Assuming these data, an iterative analysis was performed
modeling in the following way:
i)
Transient-state seepage analysis
.- The variation of water
level was evaluated by a transient-state flow analysis and
the pore pressures induced by seepage (
p
seepage
) were
calculated by using the PLAXFLOW program. In this
analysis a linear variation of hydraulic head versus time
was specified as a boundary condition.
ii)
Deformation analysis
.- The results obtained in the seepage
analysis were used by PLAXIS and a deformation
analysis in order to evaluate the excess pore water
pressure induced by changes in total stresses was then
performed.
iii)
Consolidation analysis
.- Finally, the dissipation of excess
pore water pressure occurred during the drawdown
condition was computed.
iv)
Stability analysis
.- After completing the drawdown stages,
stability analyses were carried out for each stage
(including the initial steady-state condition) using the
results obtained in all previous analyses.
Table 1. Mechanical, hydraulic and rigidity properties of both the levee
nd the foundation soil.
a
Property
Unity
Value
(soil unit weight)
kN/m
3
20
k
(hydraulic conductivity)
cm/s
1×10
-4
and 1×10
-6
c
´ (effective cohesion)
kN/m
2
10
�
´ (effective friction angle)
°
20
(dilatancy angle)
°
0
ref
(secant stiffness for CD triaxial)
kN/m
2
1000
oed
ref
(tangent oedometer stiffness)
kN/m
2
1000
ur
ref
(unloading/reloading stiffness)
kN/m
2
3000
(Poisson’s ratio)
---
0.2
P
ref
(reference stress)
kN/m
2
100
m
(power for stress dependent on stiffness)
---
0.7
3.4
Results of analyses
With the aim of better understand the drawdown phenomenon, a
material having a hydraulic conductivity of
k
= 1×10
-6
cm/s and
drawdown rate of
R
= 1.0 m/d was considered to initially study
the influence of drawdown ratio on remaining pore water
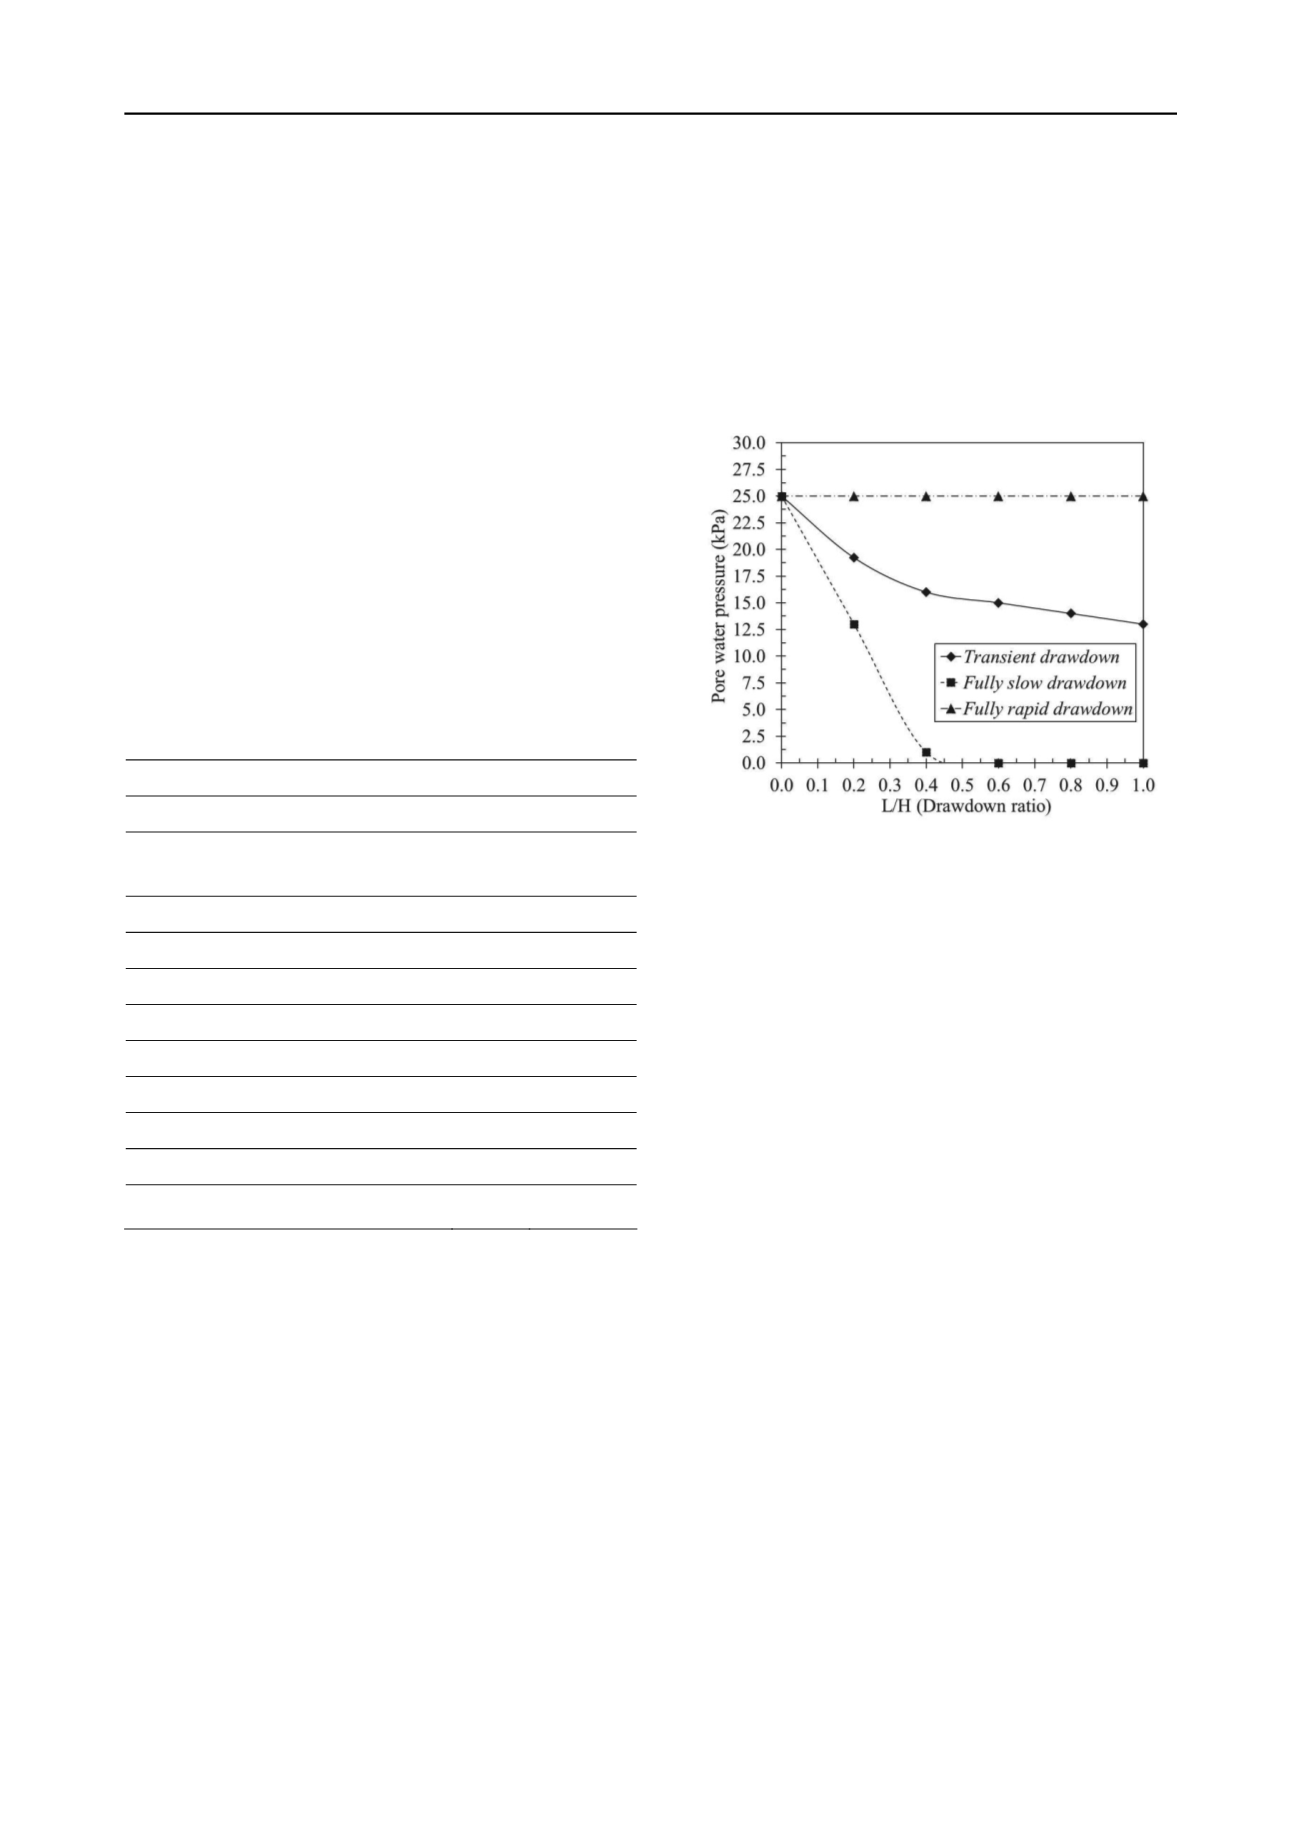
pressure within the levee. Figure 3 shows the progress of the
pore water pressure computed at point P
A
(which is illustrated in
Figure 2), assuming the three drawdown modes mentioned
before (Fig. 1). In this figure it can be observed that in the
fully
slow drawdown
mode the pore water pressure significantly
decreases as a function of the drawdown ratio L/H, whereas in
the
fully rapid drawdown
the pore pressure remains constant
and is equals to the initial pore pressure (steady-state), because
in this case it is assumed that water surface is preserved at the
initial level during each time of the drawdown. In the
transient
drawdown
, the pore water pressure does not decrease at the
same drawdown ratio as in the
fully slow drawdown
, but it is not
conserved as high as in the
fully rapid drawdown
case. In this
situation, the resulting pore water pressures are not in
equilibrium with the new boundary conditions, so a transient
flow regime is developed. This is due to the remaining water
seepage within the body of the levee momentarily prevents the
dissipation of pore pressures generated during the drawdown. In
the same Figure 3 it can also be concluded that if an analysis
taking into account the distribution of remaining pore water
pressures and assuming
fully slow
or
fully rapid
drawdown
modes is performed, the safety factors of the slope when
external water level changes are underestimated or
overestimated, respectively. Therefore, to analyze the stability
of protection levees under drawdown conditions is
recommended that a transient flow analysis type is applied.
Figure 3. Pore water pressure versus drawdown ratio (L/H) considering
different drawdown modes for H=6 m height, k=1×10
-6
cm/s
permeability and R=1.0 m/d drawdown rate.
Subsequently, the effects of hydraulic conductivity
k
and
drawdown rate
R
on slope stability were analyzed. Figure 4
illustrates the variation of safety factor (FoS) as a function of
the drawdown ratio (L/H) for different combinations of
k
and
R
assumed in analyses. From the above figure it can be seen that
the behavior of low permeability soils (
k
= 1×10
-6
cm/s)
subjected to a relatively rapid drawdown rate (
R
= 1.0 m/d) is
very similar to that showed in Figure 1c (the phreatic surface
practically remains near the crown of the slope), consequently
in this situation it can be supposed a
fully rapid drawdown
condition and an undrained method can be applied for
calculations, that is, groundwater seepage analyses can be
omitted. For more permeable soils (
k
= 1×10
-4
cm/s) and a
relatively slow drawdown rate (
R
= 0.1 m/d), the soil behavior
is similar to Figure 1a (the water table practically descends at
the same time than the reservoir water level), as a result, in this
case a
fully slow drawdown
condition can be assumed and a
water flow analysis (uncoupled) can only be utilized for
calculations, this is because the excess pore water pressure
generated by changes in the total stresses dissipates at the same
velocity than the water level in the reservoir decreases. For
intermediate conditions concerning to permeability and
drawdown rate, calculations cannot be approximated to these
two extreme cases, due to the computed safety factors differ
from reality. For such cases, it is necessary to apply coupled
transient flow-deformation analysis. From Figure 4 it can also
be concluded that the dissipation velocity of pore water pressure
mainly depends on the permeability of material and the
drawdown rate.


