3054
Proceedings of the 18
th
International Conference on Soil Mechanics and Geotechnical Engineering, Paris 2013
2 MATERIALS AND METHODOLOGY
Works in the literature have shown that conventional direct
shear tests under low normal stresses levels can overestimate
the values of interface friction angle (Girard
et al.
1994, Izgin
and Wasti 1998, Koutsourais
et al.
1998, Lopes 2001, Rebelo
2003). Because of this limitation ramp tests have been
increasingly used. ISO 12957-2 (2005) normalizes the
execution of this type of test.
In this work ramp and conventional direct shear tests for
interface shear strength evaluation were carried out varying the
soil degree of saturation between 5.5 and 66%.
The soil used in the tests had 12% of fines. Table 1
shows soil proprieties.
Table 1. Soil proprieties.
Propieties
Value
s
(kN/m
3
)
2,63
d
(kN/m
3
)
14,14
e
max
1,05
e
min
0,67
Relative Density (%)
50
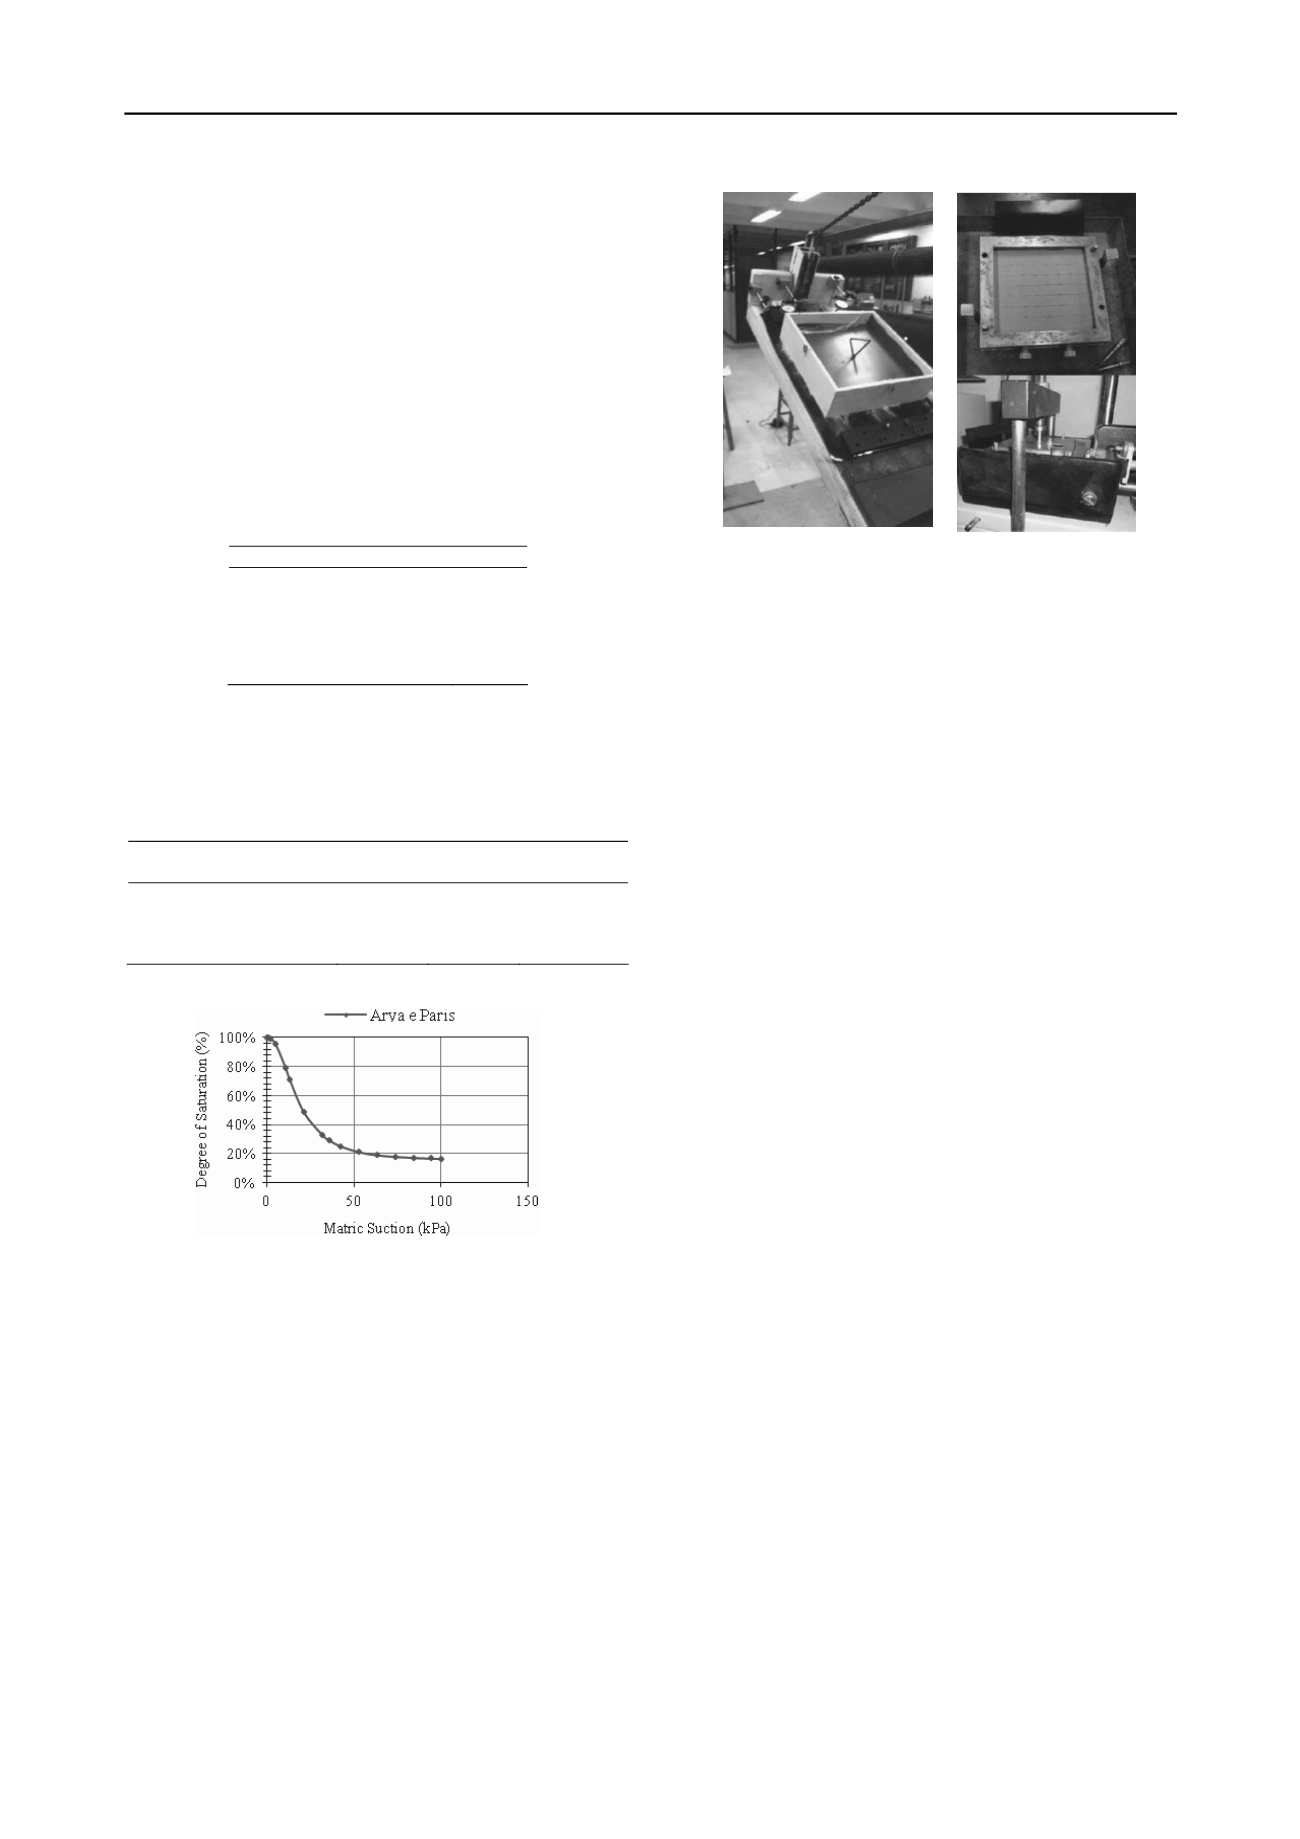
The soil retention curve was estimated using Arya and
Paris’ model (1981), and is presented in Figure 1. PVC and
HDPE (smooth and texturized) geomembranes were tested (See
Table 2).
Table 2. Proprieties of geomembranes.
Propriety
PVC
Smooth
HDPE
Textured
HDPE
Thickness (mm)
1.0
1.0
1.0
Mass per unit area (g/m
2
)
1.2-1.35
0.947
0.946
Maximum force at Failure
(kN/m)
14
35.5
33
Figure 1. Estimated retention curve obtained from Arya and Paris
(1981).
Seventy five ramp tests were performed where the
following parameters were evaluated: interface friction angle
(
φ
sg
); maximum relative soil displacements immediately before
failure (δ
máx
) and mobilized tensile load in the geomembrane
(F). In addition, 50 conventional direct shear tests were also
carried out with the same soil and PVC and HDPE
geomembranes.
The dimensions of the specimens and normal stresses in
the ramp tests were equal to 51 cm x 51 cm and 1.2 kPa, 3.2 kPa
and 7.2 kPa, respectively. These values were based on others
studies and they aimed at simulating low confining pressures
when only a thin cover soil (or drainage layer) is on the
geomembrane in a slope of a waste disposal area.
(a)
(b)
Figure 2. (a) Ramp test and (b) Conventional direct shear test.
Double layers of lubricated plastic films were used
underneath the geomembrane specimen to reduce friction
between the geomembrane and the ramp smooth metallic
surface. This procedure was adopted to maximize the
mobilization of tensile force in the geomembrane. The top
extremity of the geomembrane specimen was fixed to the ramp
structure by a clamping system connected to a load cell. This
allowed the measurement of mobilized tensile forces in the
geomembrane during the test. Figure 2 (a) presents a general
view of one of the ramp tests performed.
For the conventional direct shear tests, the specimens
had a plan area of 100 cm
2
(10 cm x 10 cm, Fig. 2b) and higher
confining pressures were used, with values equal to 25 kPa, 55
kPa and 150 kPa.
3 RESULTS OBTAINED
3.1 Interface friction angle
Table 1 and Figure 3 present values of interface friction angles
obtained from ramp and conventional direct shear tests for the
range of degree of saturation tested. Mean and standard
deviation values are also presented in Table 1.
The interface friction angles obtained were rather
insensitive to changes in the soil saturation degree (S
r
) for the
interfaces tested. The variations of results can be considered to
be within the expected scatter of results in this type of test. The
standard deviation varied between 1.5
o
and 3
o
with large
variations having occurred for the direct shear tests. The highest
interface friction angle in the test with the texturized HDPE
geomembrane was obtained for the highest value of degree of
saturation. However, it was noticed that for higher values of S
r
a
certain amount of soil intruded between the soil box and the
ramp, influencing the results to some extent. The same can be
noticed for the test with the smooth PVC geomembrane.
A progressive failure mechanism was observed in the
tests with the PVC geomembrane because of the extensible
nature of this geomembrane. Figure 4 shows a view of the
anchored extremity of the geomembrane specimen in one of the
tests with the PVC geomembrane, where it can be seen that a
greater amount of soil adhered to the geomembrane for the
lower value of degree of saturation, probably due to the greater
soil-geomembrane adhesion under low moisture content. The
results of interface friction angle obtained in the on the smooth
HDPE geomembrane were smaller than those obtained for the
texturized geomembrane, as expected, and also insensitive to
the variation of soil degree of saturation.


