3055
Technical Committee 215 /
Comité technique 215
Table 1. Interface Friction angles obtained in ramp and direct shear
tests.
φ
S-PVC S
(°)
φ
S-HDPE S
(°)
φ
S-HDPE T
(°)
S
r
(%)
RT
DS
RT
DS
RT
5.5
29
30
26
27
32
10.8
30
30
28
29
33
15.7
30
31
27
27
34
20.3
30
32
29
32
30
26.3
31
33
29
31
36
45.1
31
33
30
31
37
58.4
30
33
27
29
36
66
34
39
27
31
39
Average
(°)
30.6 32.6 27.9
29.6
34.6
Median (°) 30.5 33.0 29.0
33.0
33.0
Variance
(°)
2.3
8.3
1.8
3.7
8.6
Standard
Deviation
(°)
1.5
2.9
1.4
1.9
2.9
Coefficient
of
variation
(%)
4.9
8.8
4.9
6.5
8.4
DS: Direct shear tests
RT: Ramp tests
PVC S – Smooth PVC geomembrane
HDPE S – Smooth HDPE geomembrane
HDPE T – Texturised HDPE geomembrane
S
r
– soil degree of saturation
Figure 3. Interface friction angle (
φ
sg
)
versus
degree of saturation.
The higher values of interface friction angle were
obtained in the tests on the texturized HDPE geomembrane.
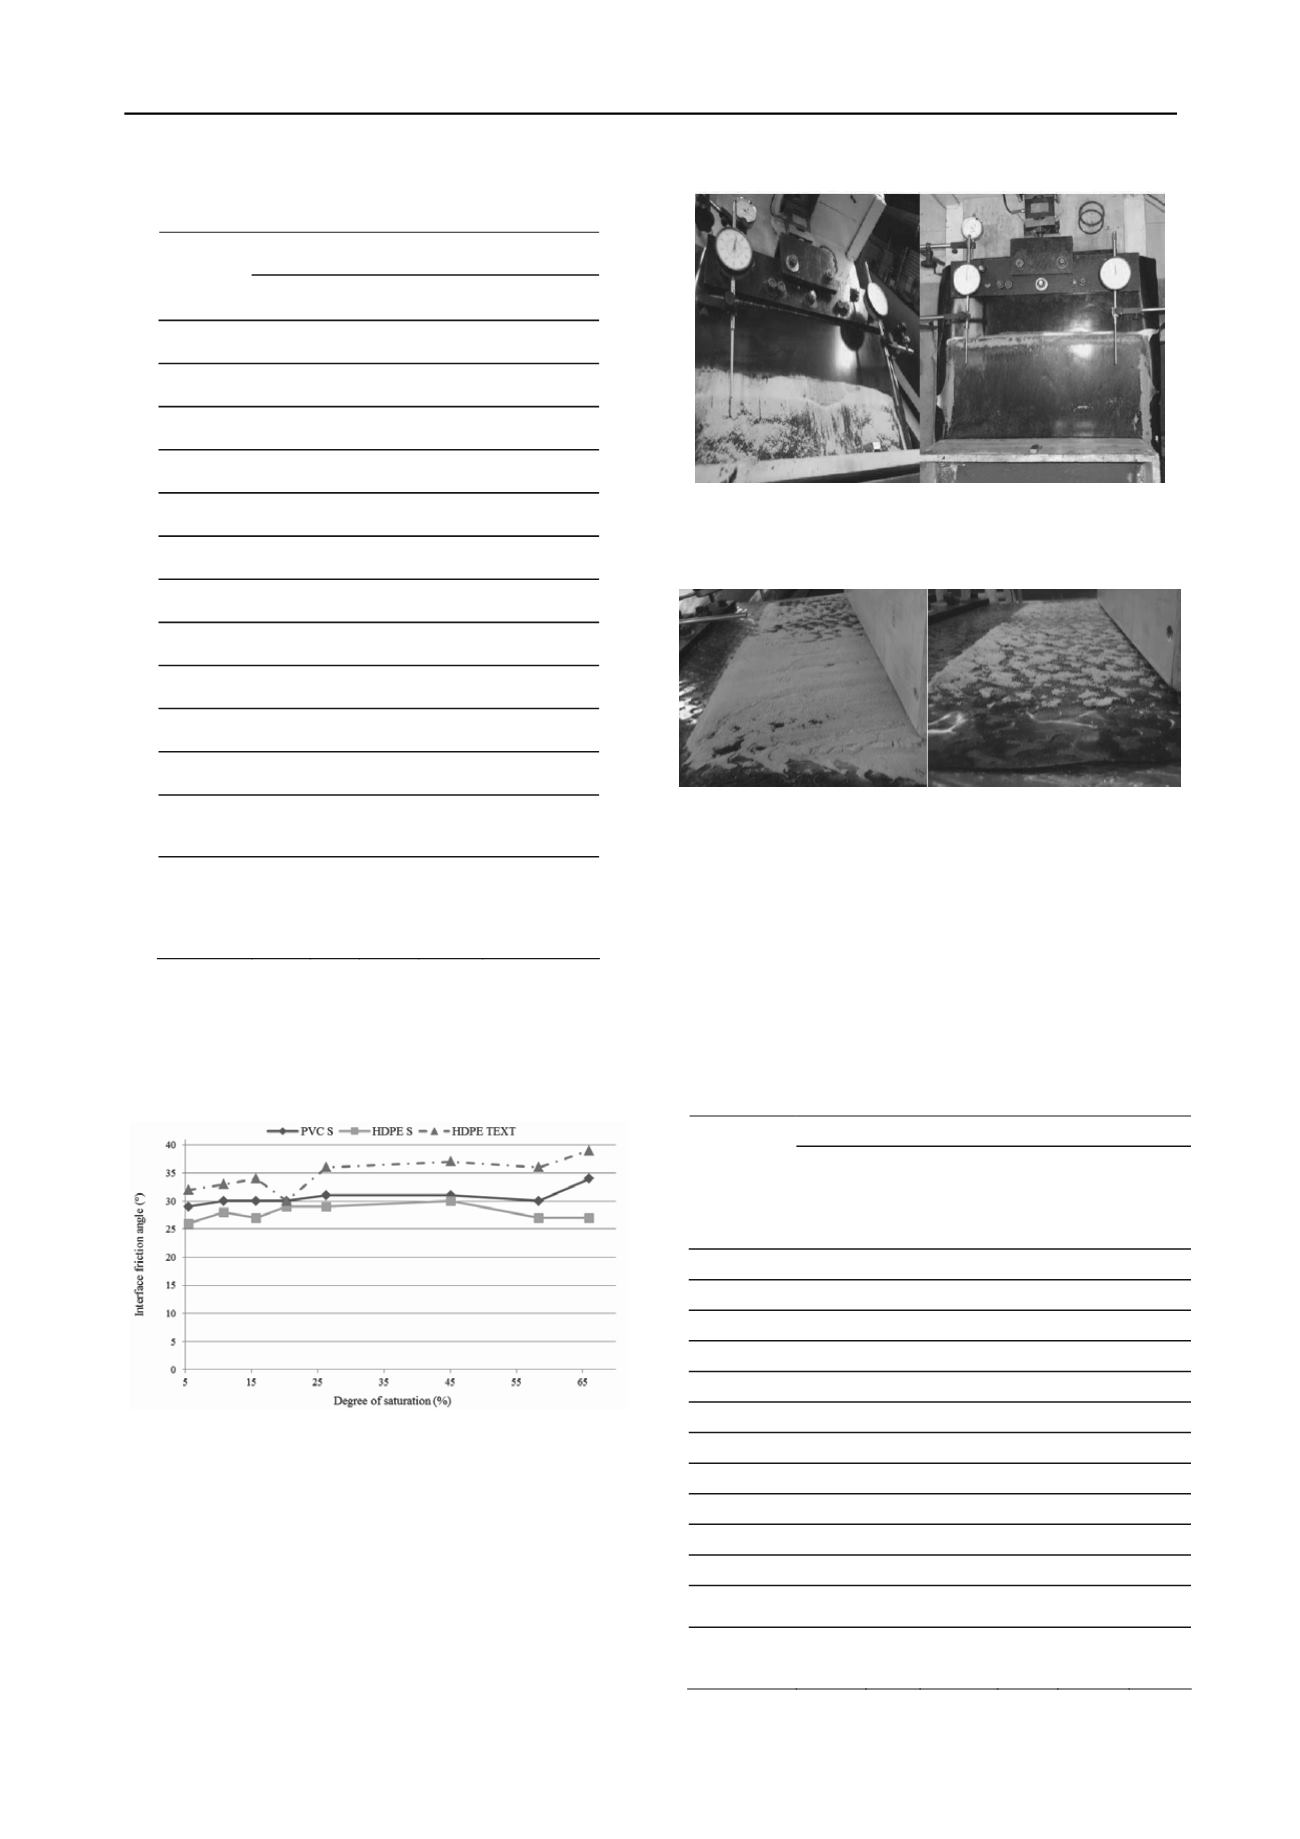
Figure 5 shows images of tests on the texturized HDPE
geomembrane for different values of soil degree of saturation.
Greater amount of soil adhered to the geomembrane for the
lower value of degree of saturation as also observe in the test
with the s
mooth
PVC geomembrane.
(a) (b)
Figure 4. Tests on smooth PVC geomembrane: (a) degree of saturation
of 5.5% and (b) degree of saturation of 66%.
(a)
(b)
Figure 5. Tests on texturized HDPE geomembrane: (a) degree of
saturation of 5.5% and (b) degree of saturation of 66%.
3.2 Additional parameters to interface shear strength
Table 2 sumarizes results of maximum box displacements (δ
max
)
immediately before interface failure as well as mobilized tensile
forces (F) in the geomembrane. Some increase on δ
max
with soil
degree of saturation can be noted for the tests with the PVC
geomembrane.
Table 2. Maximum box displacements and mobilised force in the
geomembranes obtained in ramp tests.
PVC L
PEAD L
PEAD T
S
r
(%)
δh
max
(mm)
F
(kN/
m)
δh
max
(mm)
F
(kN/
m)
δh
max
(mm)
F
(kN/
m)
5.5
39.2
0.61
70
1
70.3
1
10.8
43.7
0.6
68.6
0.9
67.5
1
15.7
51.7
0.6
71.5
0.8
72
1.3
20.3
51.2
0.7
82.4
1.1
74.4
1
26.3
54.58
0.52
67.66
0.8
73
1.2
45.1
49.7
0.5
73.7
0.8
69.6
1.3
58.4
45
2
71.54
1.2
47.5
1.5
66
43.9
0.9
73.36
0.8
69.2
1.1
Average
47.4
0.8
72.3
0.9
67.9
1.2
Median
52.89
0.61
75.0
1.0
73.7
1.1
Variance
27.0
0.2
21.0
0.0
73.1
0.0
Standard
Deviation
5.2
0.5
4.6
0.2
8.6
0.2
Coefficient
of variation
(%)
11.0
62.1
6.3
17.1
12.6
15.6


