3062
Proceedings of the 18
th
International Conference on Soil Mechanics and Geotechnical Engineering, Paris 2013
Proceedings of the 18
th
International Conference on Soil Mechanics and Geotechnical Engineering, Paris 2013
2 EXPERIMENTAL PROGRAM
This research analyzes the hydration behavior of the GCL from
underlying soil under different field exposure conditions,
including daily thermal cycles before waste placement, and
constant temperatures induced by the waste decomposition after
waste placement. Also, the effect of normal stresses provided by
the overlying layers (e.g., Leachate Collection System (LCS),
cover soil) is investigated. The hydration progression of three
GCL products (GCL1, GCL2, and GCL3) which have
significantly different manufacturing techniques has been
evaluated in this study. Ontario Leda clay (CL in USCS
classification system, ASTM D2487), clayey sand (SC), silty
sand (SM), and ordinary construction sand (SP) were used to
investigate the effect of the subsoil grain size distribution on
GCL hydration. The hydration process was monitored by
measuring the gravimetric moisture content (i.e. mass of
water/mass of dry material) of the GCL up to 40 weeks.
2.1
GCL properties
GCL 1 and GCL2 contained fine granular sodium bentonite
with D
50
of 0.35 mm while GCL3 was coarse granular with D
50
of 1 mm. All GCLs had NW cover geotextiles. The main
difference of the GCLs was the connection layer and also the
type of the carrier geotextile (Table 1). GCL1 and GCL2 had
similar swell and plasticity indices of 24 ml/ 2g min. and 216%
(ASTM D 4318), respectively. GCL3 had a swell index of 23
ml/ 2g min. and plasticity index of 262%. The water retention
curves for these GCLs have been presented by Beddoe et al.
(2011). The submerged moisture content, i.e., the maximum
gravimetric moisture content which the GCL could attain while
immersed in water is also given in Table 1.
Table 1. GCL properties
GCL
Total dry
mass/area
(g/m
2
)
Carrier/
Cover
Geotextile
Connection
Layer
Submerged
Moisture
Content
1 4555-4988
W/ NW
NPTT
150±10
2 3312-4006
SRNW/ NW
NPTT
118±5
3 4499-5295
W/ NW
NP
190±10
W = Woven, NW = Nonwoven, SRNW = Scrim reinforced nonwoven,
P = Needle punched, NPTT = Needle punched and thermally treated.
N
2.2
Soil properties
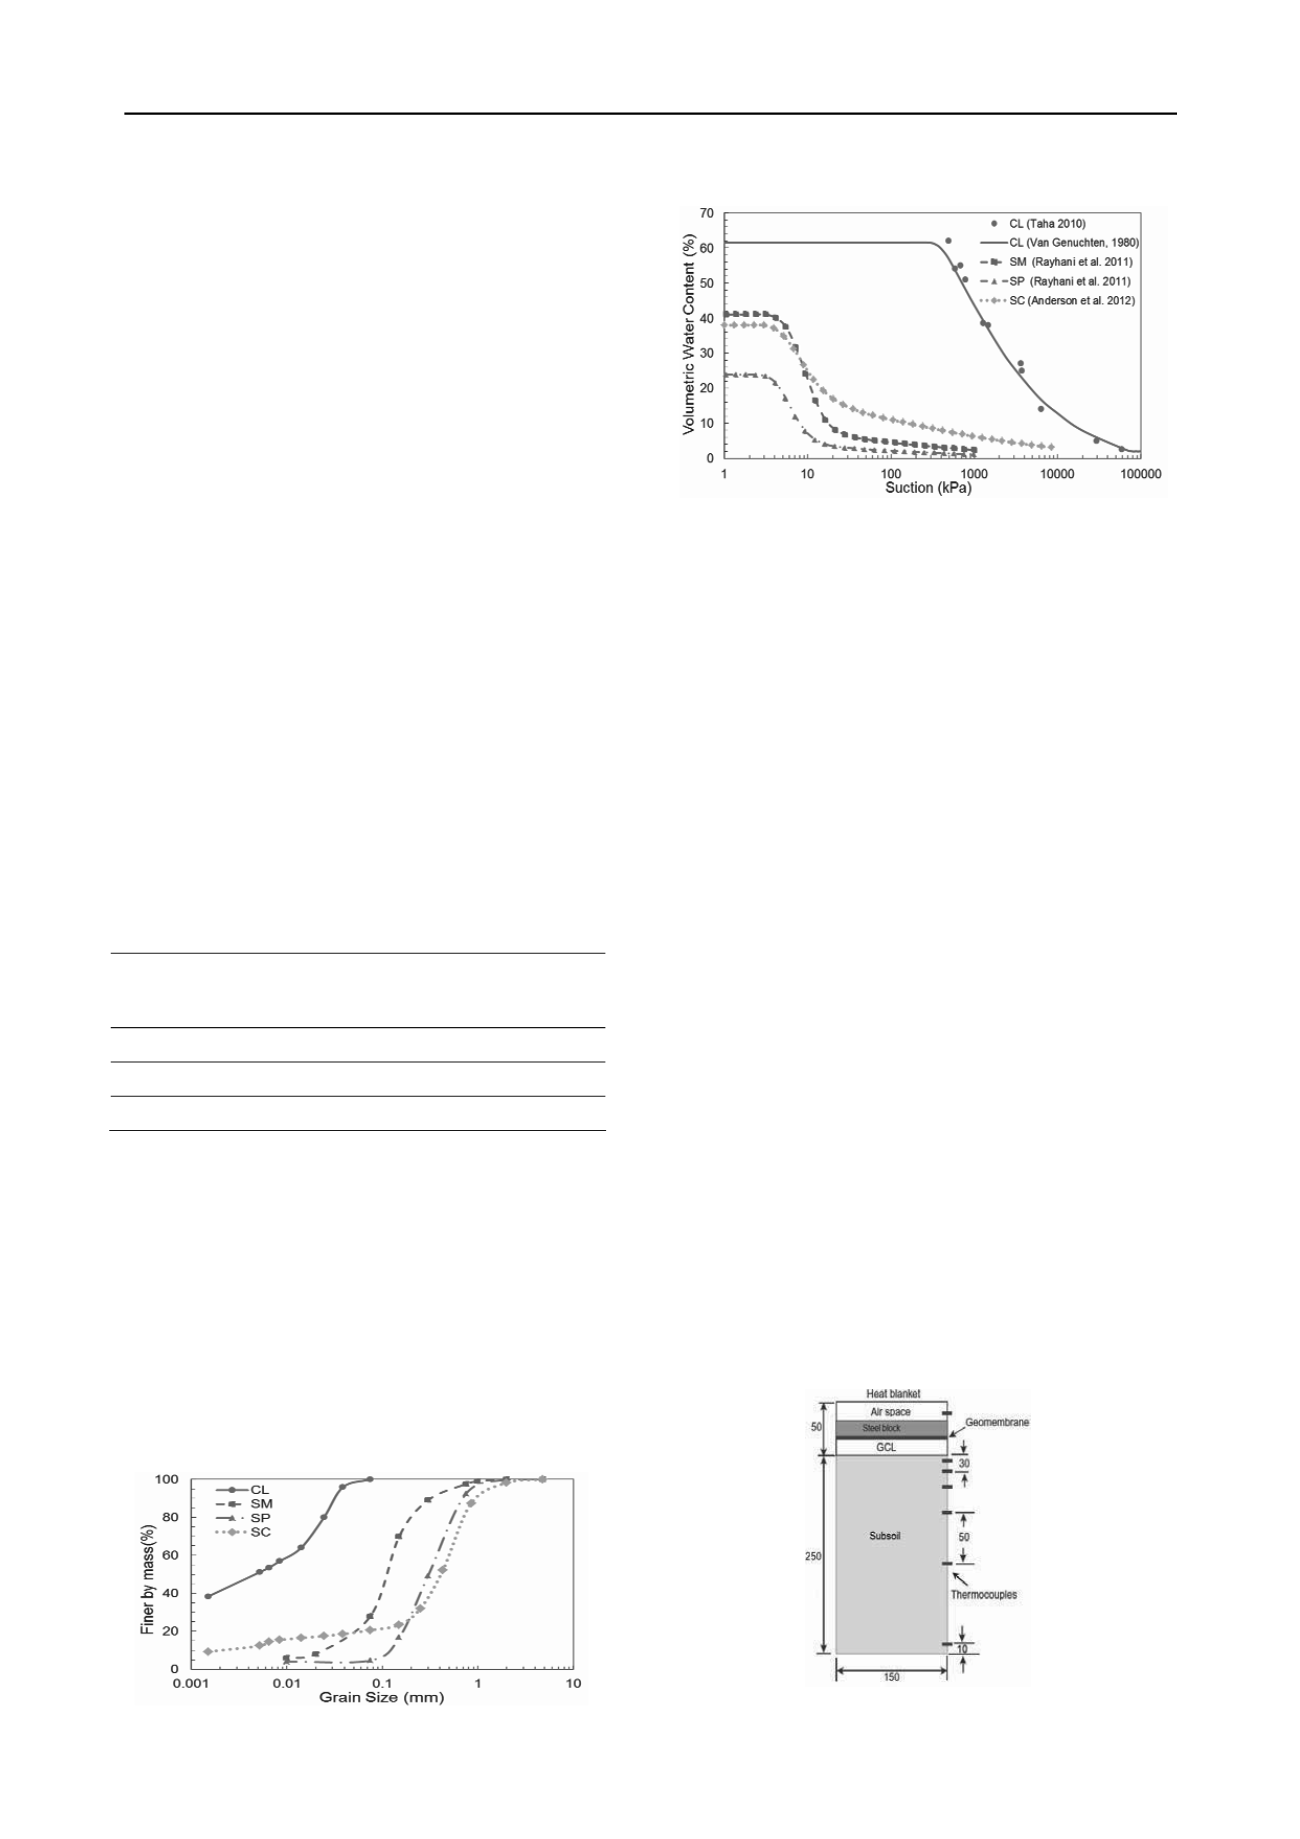
The basic geotechnical properties of the four subsoils were
determined through laboratory testing (Figure 1). The sand (SP),
silty sand (SM), and clayey sand (SC) contained 5%, 35%, and
21% fines passing through the 0.075 mm sieve, respectively.
The plasticity indices of the clay and the fine portion of clayey
sand were measured at 21.6%, and 4%, respectively (ASTM D
4318). The maximum dry densities of the sand, silty sand,
clayey sand, and clay were measured at 1.68, 1.83, 1.96, and
1.43 Mg/m
3
with the corresponding optimum moisture contents
of 10%, 11.4%, 11.3%, and 28.3%, respectively (
ASTM D 698
).
(a)
Figure 1. (a) Grain size distributio (b) matric suction curves for the
2.3
Sample preparation
am of instrumented test cells
2.4
Experimental procedure
ct of constant temperature on
i
y
n and
subsoils examined.
Figure 2 demonstrates the diagr
used for simulating GCL hydration from subsoil. To simulate
the profile of a composite liner, the soil under examination was
placed in cells having a diameter of 150 mm and a height of up
to 500 mm. Tap water with an average calcium concentration of
40 mg/L was mixed with bulk samples of dried soils to the wet
of optimum moisture content (
w
opt
+ 2%). Some soil samples
were watered to other gravimetric moisture content to evaluate
the effect of the initial moisture content (10%). The soil samples
were wrapped in airtight plastic bags to cure overnight.
Afterwards, the soil was compacted into the PVC cylinders in
five layers with a final height of 250 mm, and a dry density
corresponding to approximately 90% of the maximum dry
density. The GCL sample was placed over the subsoil and
overlain by geomembrane. A steel seating block with a known
weight corresponding to a specific level of normal stress (0-8
kPa) was placed on the liner. The test cells were closed and
sealed to prevent any loss of moisture, and were opened weekly
to determine the mass before returning them to the cells.
In order to investigate the effe
GCL hydration after waste deposition, heating blankets set to
the temperatures of 35, 45, and 55
C were placed on top of a
series of test cells. Some cells were left in room temperature
(22
±2C) for isothermal and control experiments. Also, heat
was applied for 8 hours to the top of some cells before they
were subsequently left in room temperature (22
C) for 16 hours
to simulate daily thermal (heating and cooling) cycles induced
by solar radiation. The sides of all cells were surrounded by
fibreglass insulation while their bottom was maintained at room
temperature to simulate vertical thermal gradients developed in
the field. Also, after 6 weeks of daily thermal cycles, the heating
cycles were brought to a halt for a period of 6 weeks to simulate
seasonal cooling periods before they were resumed.
F gure 2. Diagram of instrumented test cells used for simulating GCL
dration from subsoil (numbers in mm)
h


