3070
Proceedings of the 18
th
International Conference on Soil Mechanics and Geotechnical Engineering, Paris 2013
Proceedings of the 18
th
International Conference on Soil Mechanics and Geotechnical Engineering, Paris 2013
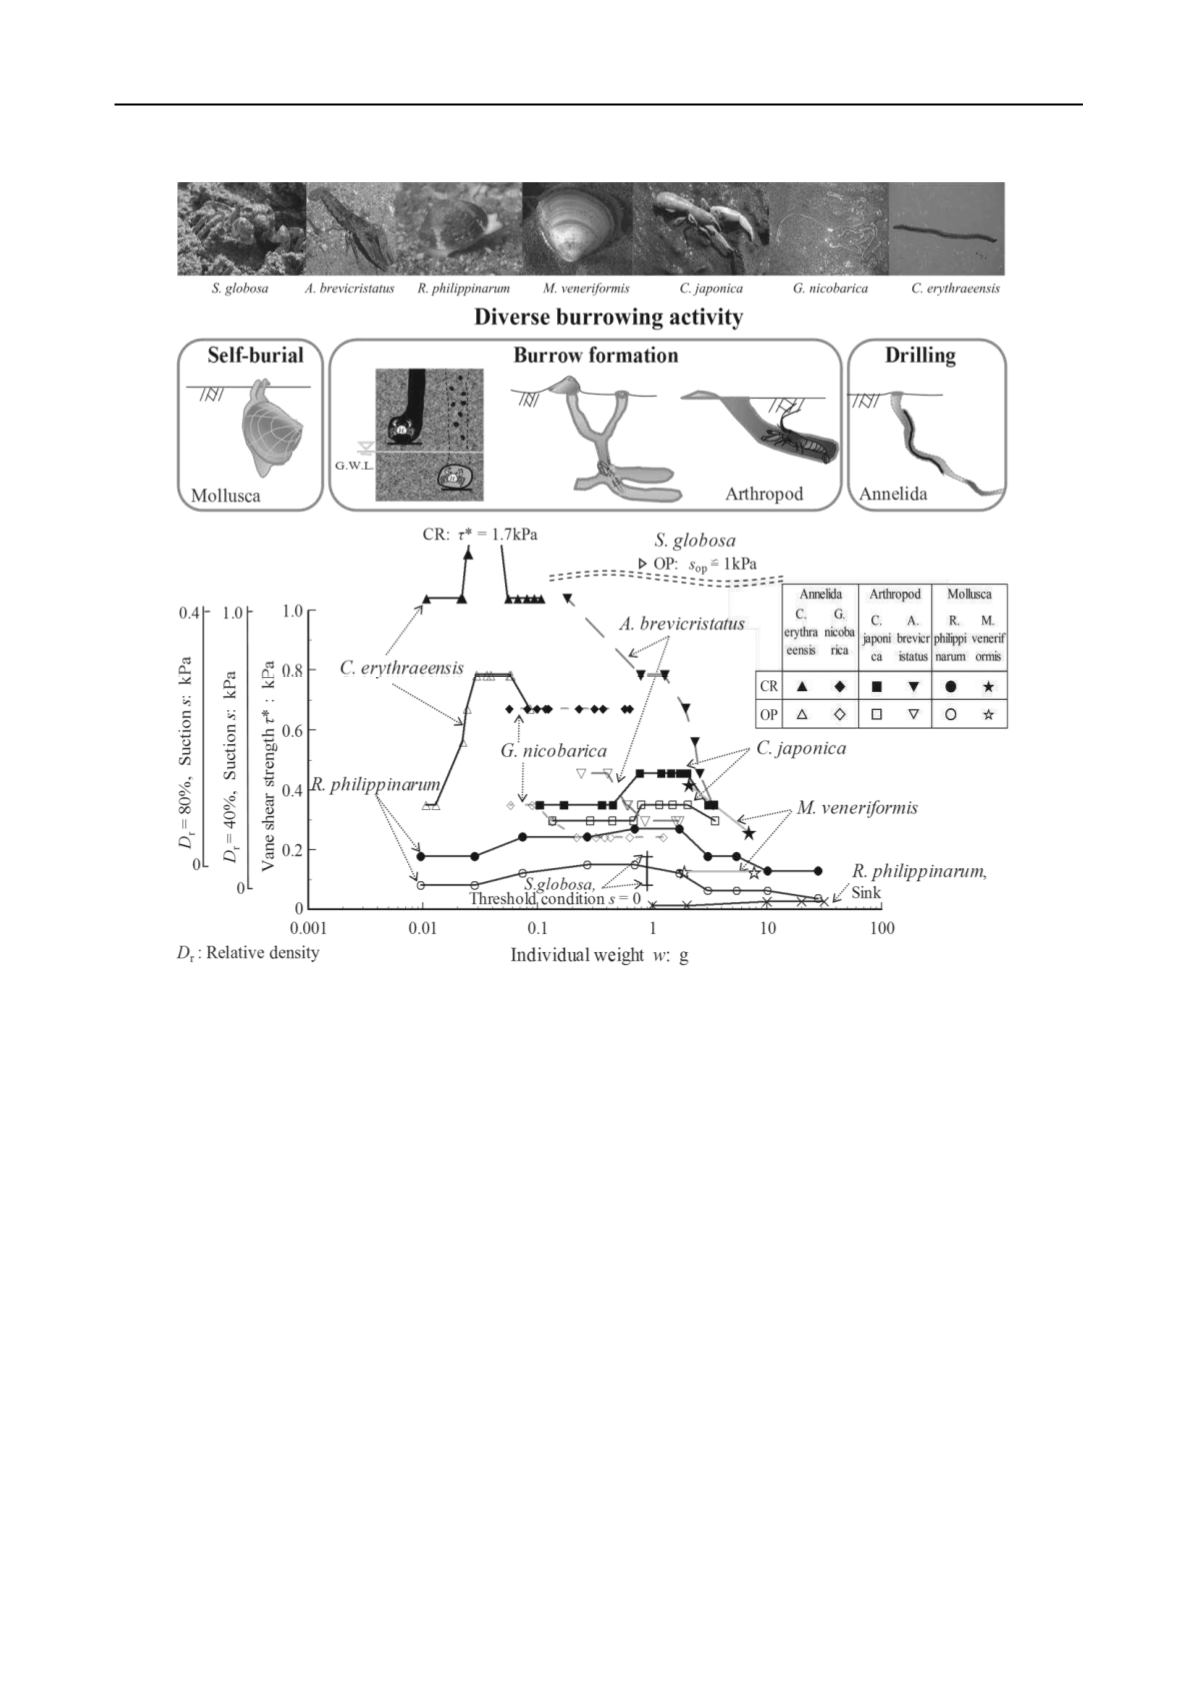
a total of 835 individuals whose body sizes ranged from 2mm to
88mm and whose body weights ranged from 0.004g to 31.6g.
The experimental results are summarized in Fig. 1. This
figure shows three burrowing regions, namely, an optimal
region (below OP) where all individuals burrowed, a
transitional region (between OP and CR) where burrowing
success and failure mixed, and a critical region (above CR)
where all individuals failed to burrow, in light of the vane shear
strength. The associated suction ranges for the two different
relative densities, 40% and 80%, were obtained on the basis of
the calibration experiments of the tidal flat soils. The data are
plotted for each species and growth stage as characterized by
the individual weights. Note here that the threshold condition
represents the situation where the sand bubbler crab cannot
form burrows without suction. Figure 1 shows that for all the
species and growth stages, there existed both suitable and
critical conditions for burrowing, which differed considerably
between species in a complex manner. This burrowing
performance chart is named here the ecohabitat chart, which
will be clarified in detail below.
3 VERIFICATION OF ECOHABITAT CHART
We performed field surveys at five natural and artificial
intertidal flats located in Japan from 2009 to 2011. Specifically,
we conducted integrated surveys of thegeophysical environment
and the species distributions during spring low tides at the
Nojima intertidal flat in March 2009 and September 2010, at the
Shirakawa intertidal flat in September 2009, at the Isumigawa
intertidal flat in August 2009, at the Naha intertidal flat in June
and December 2009 and February and September 2011, and at
the Tokuyama artificial intertidal flat in September 2010 and
June 2011. At each intertidal flat, we measured the spatial
distributions of suction, groundwater level and vane shear
strength, and collected undisturbed samples of surficial
sediments of 50mm thickness, and subjected them to a series of
laboratory soil tests to determine their grain size distributions,
water content ratio
w
, specific gravity
G
s
, void ratio
e
, relative
density
D
r
and the degree of saturation
S
r
=
G
s
·
w
/
e
. At each
location of the geophysical measurements described above, we
took four core samples of 200mm diameter and 100mm
thickness to obtain the density distributions (mean
±
SE) of the
two different bivalves of various growth stages,
R.
philippinarum
(Manila clam) and
M. veneriformis
at the
Shirakawa intertidal flat, and the burrow density distributions of
the sand bubbler crab
S. globosa
and the decapod crustacean
C.
japonica at
the Naha and Isumigawa intertidal flats, and
measured and identified the species, individual densities and
weights for each category of Arthropoda, Mollusca, and
Annelida at the Tokuyama artificial intertidal flat. We compared
the species distributions with the corresponding geophysical
measurements obtained through these field surveys and
laboratory tests, and analyzed them in light of the ecohabitat
chart developed in this study.
At all the five natural and artificial intertidal flats, there
Figure 1. Ecohabitat chart and the interrelationships between optimal and critical geoenvironment among species in intertidal flats


