3079
Technical Committee 215 /
Comité technique 215
reduction of nitrate in the groundwater.
DNA sequencing is relatively expensive, and therefore
cheaper techniques for monitoring microbial populations are
useful in order to decide whether more detailed analysis is
required. There are several ways of “fingerprinting” a microbial
population, the most useful of which, due to its simplicity of use
and low cost, is probably RISA (Borneman, 1997). RISA
exploits differences in the length of bacterial DNA between two
genes: the 16S and 23S rRNA genes. This varies between 150
and 1500bp. The analysis uses a PCR that amplifies the
intergenic spacer region using primers that target conserved
sections of DNA (within the 16S and 23S genes) that flank the
region (Cardinale, 2004). The PCR product is then size
separated using agarose gel electrophoresis; the patterns in the
bands that are visible on the gel image are a fingerprint for the
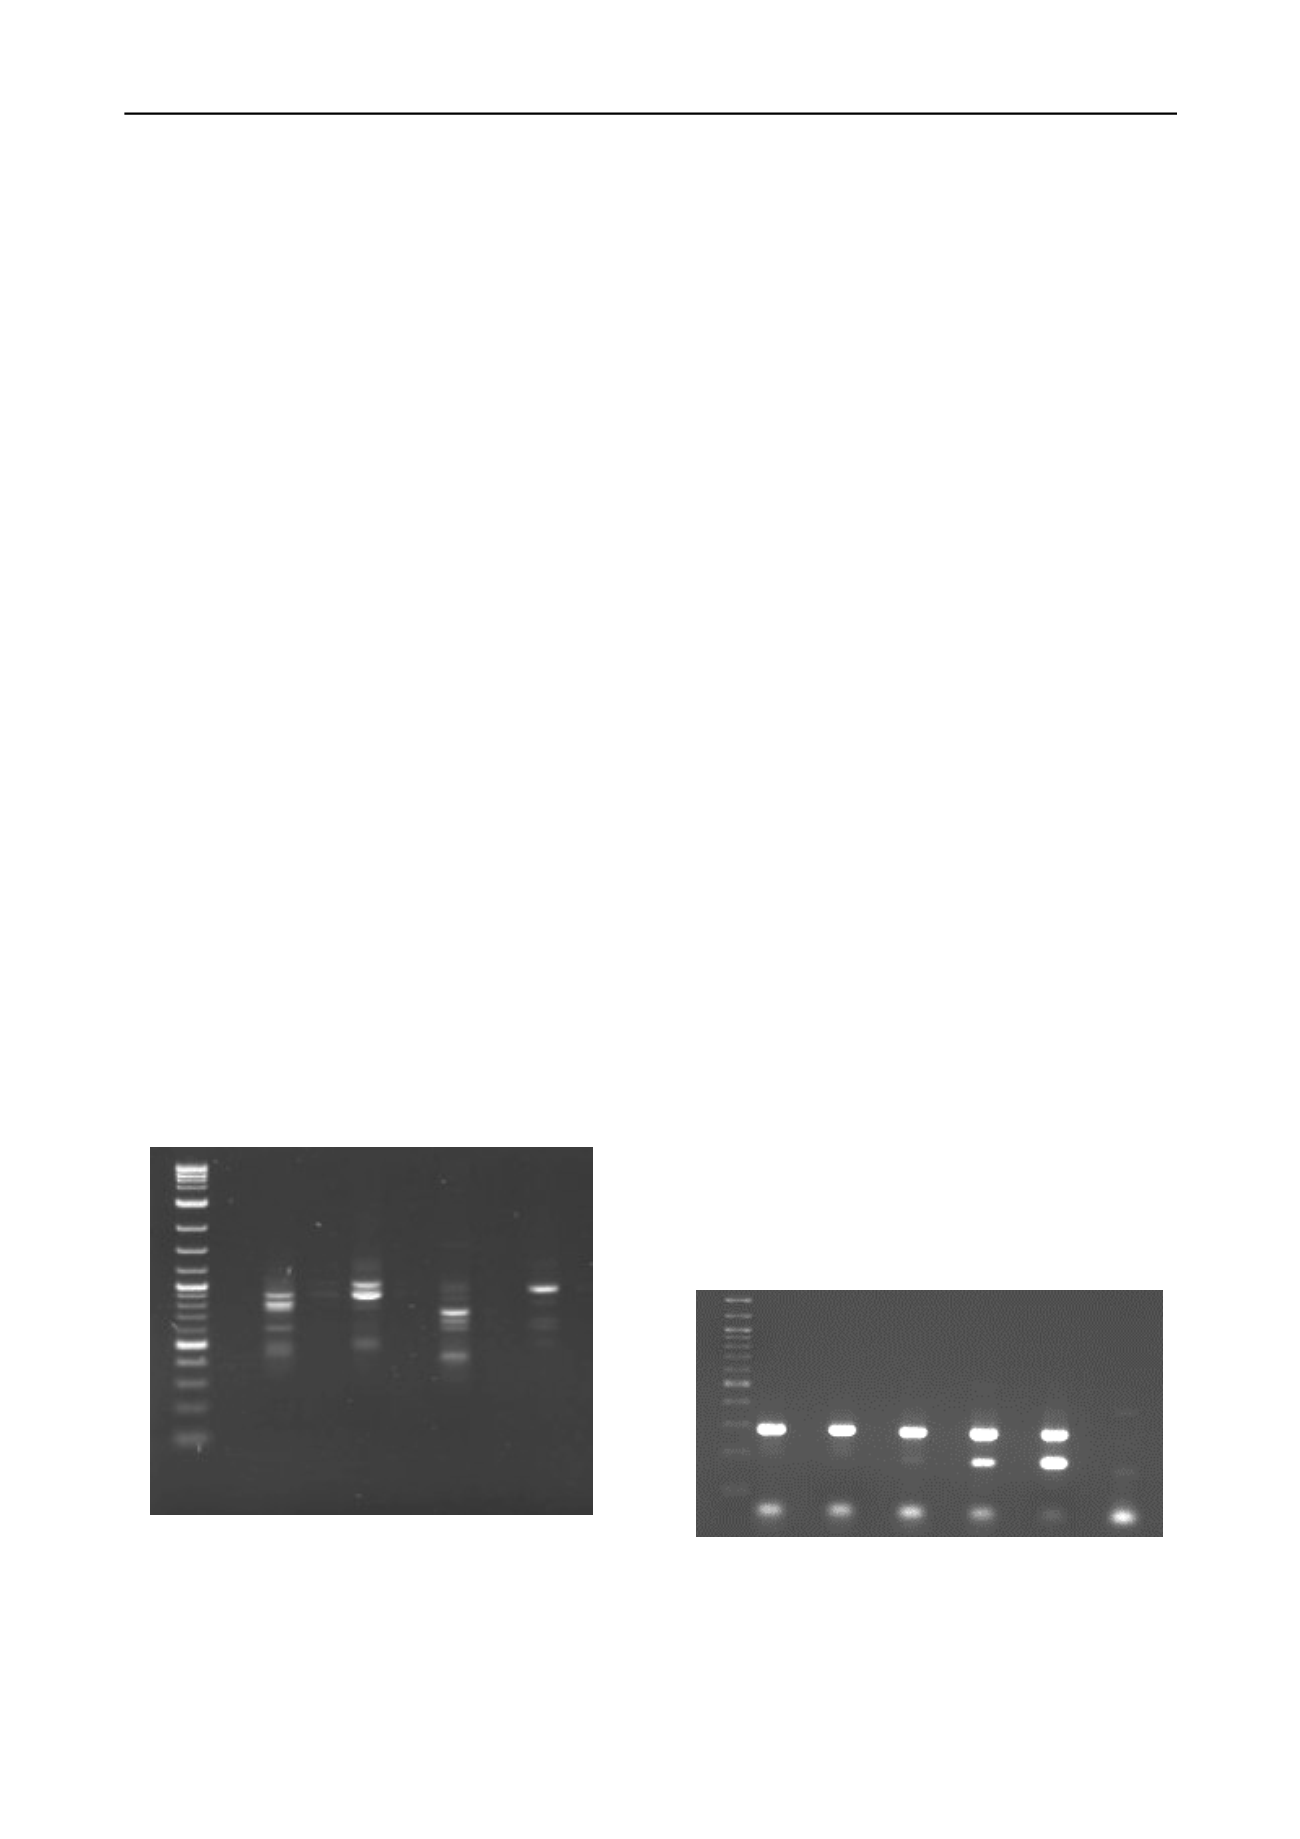
bacterial population. Figure 2 shows a RISA gel image from a
study of a soil/groundwater system investigating the effect of
different amendments (bicarbonate and acetate) on the
microbial population. The gel image shows that microbial
populations were significantly different 175 days after
amendment.
High-throughput sequencing (or next-generation sequencing)
technologies read many thousands of sequences in parallel.
There are a variety of “platforms” for high-throughput
sequencing (see Metzker 2010 for a review), but for brevity this
paper will focus on 454 pyrosequencing as, possibly, the most
straight-forward approach to creating a 16S rRNA gene library.
It employs an initial PCR reaction on a DNA sample to isolate
the gene fragment of interest and attach “adapter” sequences to
both ends of that fragment. Unique identifier codes can also be
incorporated between the adaptor and the gene fragment at this
stage so that several samples can be sequenced at same time and
separated during subsequent analysis (potentially offering a cost
saving). During pyrosequencing fragments of the template DNA
are isolated by attaching them to microscopic DNA capture
beads using the adaptor. These beads are suspended inside water
droplets in an oil solution in separate picoliter-volume wells on
a multi-well plate. A PCR reaction using a luciferase then
generates a light signal from each well as individual nucleotides
are added to a DNA strand, which can be read in parallel.
The Roche GS FLX Titanium system can sequence
fragments of up to 600bp, including the adaptor sequences
(Roche, 2011b), which is why it is suited to 16S rRNA library
construction. However, because it requires an initial PCR to
attach the adaptors, it does not escape from problems associated
with PCR errors and bias, although a proof-reading polymerase
and a low number of PCR cycles will minimise these effects.
Other high-throughput sequencing approaches can directly
sequence environmental samples without a PCR reaction to
attach an adaptor sequence. These currently yield shorter read
lengths than the approach described above, and the post
sequencing analysis to identify the gene of interest is more
complex, but it should be noted that this is a particularly fast
moving area of scientific development, and direct sequencing of
environmental samples may become the norm in the near future.
4 PCR TECHNIQUES FOR IDENTIFYING THE
PRESENCE OF A MICROORGANISM
PCR is also used to identify the presence of a particular gene
within a bacterial population. An example of this approach is to
use a PCR reaction using primers that target the invA gene to
identify the presence of Salmonella in a sample as this gene has
very high specificity to Salmonella strains (Sunar et al. 2009).
Figure 3 shows a gel image of a product from a PCR targeting
invA gene of Salmonella (product at 285 bp). In this experiment
DNA from an environmental sample was mixed with increasing
concentrations of a competitor fragment (length 183bp), so that
the number of gene copies could be estimated (so called
competitive PCR).
5 IDENTIFYING THAT A SPECIFIC GENE IS BEING
EXPRESSED UNDER THE PREVAILING CONDITIONS
DNA contains the genes of an organism but for these genes to
perform their actions in the cell they must first be copied into
RNA which is then usually converted into proteins. Proteins
may be structural, or carry out chemical reactions. This process
of copying genes into RNA is called transcription and when a
gene is transcribed it is said to be expressed. Some genes are
expressed under all or almost all conditions others are only
expressed in specific situations, for example in the presence of a
particular electron donor or acceptor. To monitor gene
expression RT-PCR is commonly used. RT stands for reverse
transcription and describes the process of copying RNA into
DNA. In most cells information flows one way from DNA to
RNA to protein (the central dogma) but enzymes called reverse
transcriptases, isolated from some viruses, can copy RNA into
DNA. PCR only works on DNA so to amplify sequences
derived from RNA isolated from a sample an RT step has to be
carried out first. Then PCR is carried out using primers for the
gene whose expression is to be tested. This information will
generally be qualitative unless conditions are carefully
optimised to obtain quantitative data. Quantitative or qPCR
generally monitors amplification in real time to ensure that the
level of product in different reactions are compared within the
exponential phase of the cycle, and by comparison to known
standards either a relative or absolute number of gene copies
can be calculated. qPCR allows monitoring of 10s of genes but
high throughput technologies (RNA-seq: Wang et al. 2009) now
allow analysis of all the genes being expressed by an organism
at a given time (the transcriptome). However the use of this for
environmental samples ‘metatranscriptomics’ is in its infancy
(e.g. Marchetti et al. 2012).
Figure 3: Agaros
2log HCO3 HCO 3AC UN UNA C
Figure 2. RISA signatures for soil-groundwater incubations with
different amendments on day 175. HCO3
HCO
3
amended;
HCO3AC
HCO
3
& acetate amended; UN
unamended;
UNAC
acetate amended, 2log
NEB 2-log DNA ladder
e-TBE gel image showing the presence of the
Salmonella invA gene (product at 285 bp). Samples contained an
increasing concentration of a competitor fragment (product at 183bp)


