3082
Proceedings of the 18
th
International Conference on Soil Mechanics and Geotechnical Engineering, Paris 2013
no dredged bed mud. Simultaneously, a suitable
environment for living things on the bottom of water, such
as plants, insect nymphs, and shellfish, is formed.
(5) Increased water depth, release control of the nutrient salts,
and immobilization of heavy metals are realized, and an
ecosystem is preserved.
3 SAMPLES AND TEST PROCEDURES
3.1
Natural zeolite
Natural zeolite powder with particles smaller than 0.5 mm
produced in Shimane Prefecture, Japan was used as an
environment-friendly adsorbent (see Photo 1). The main
mineral composition is mordenite (see Photo 1(a)), a light green,
natural, inexpensive, and safe mineral produced from a mine.
Zeolite, which contains large cavities and channels of angstrom
scale (JSPS, 2006), exhibits characteristics of ion exchange and
gas adsorption within its structural space. For the natural zeolite
used for this study, the cavity size was 6.7
–
7.0Å (Photo 1(c),
(MINDECO, 2012)) and the cation exchange capacity is CEC =
120
–
180 meq/100 g. The main application is soil improvement,
water quality purification, etc., and it is useful to absorb
ammonia, hydrogen sulfide, and nitrous acid from water, which
cause bad odors (MINDECO, 2012). Moreover zeolite is
effective as a bacteria carrier to resolve nutrient salts in the
water (e.g. Popovici et al., 2011).
3.2
Bed mud and lake water
Bed mud was dredged using a grab type sampler at Lake Suwa
in Nagano Prefecture, Japan. Lake water was sampled at the
lakefront of Lake Suwa. The particle size distribution and
physical properties of bed mud and content of the nutrient salts
in bed mud and lake water are presented, respectively, in Figure
2 and Tables 1
–
3. In that figure and tables,
w
i
stands for the
initial water content at dredging,
s
signifies the density of soil
particle,
w
L
denotes the liquid limit,
w
P
represents the plasticity
limit,
I
P
is the plasticity index, and
L
i
is the ignition loss. Tables
2 and 3 show contents of nutrient salts in bed mud as 3000
–
150,000 times greater than those in lake water. To improve
eutrophication, countermeasures against bed mud are required.
3.3
Consolidation test
Two cases of the consolidation test of bed mud were conducted
with and without natural zeolite powder. In one case,
consolidation was conducted without natural zeolite (Case B in
column test). In another case, 10% of natural zeolite powder
(see Photo 1(b)), of which particle size is less than 0.5 mm, for
the dry mass of bed mud was added and consolidation was
conducted (Case C in column test). Consolidation pressure was
increased step by step and the loading was continued until the
water content calculated using drainage mass became
w
L
. Water
quality analysis of the drainage water was conducted after
consolidation. Analytical items are the total nitrogen (T-N),
total phosphorus (T-P), ammonia nitrogen (NH
4
-N), and
chemical oxygen demand (COD). The analytical method
followed Japanese Industrial Standards (JIS).
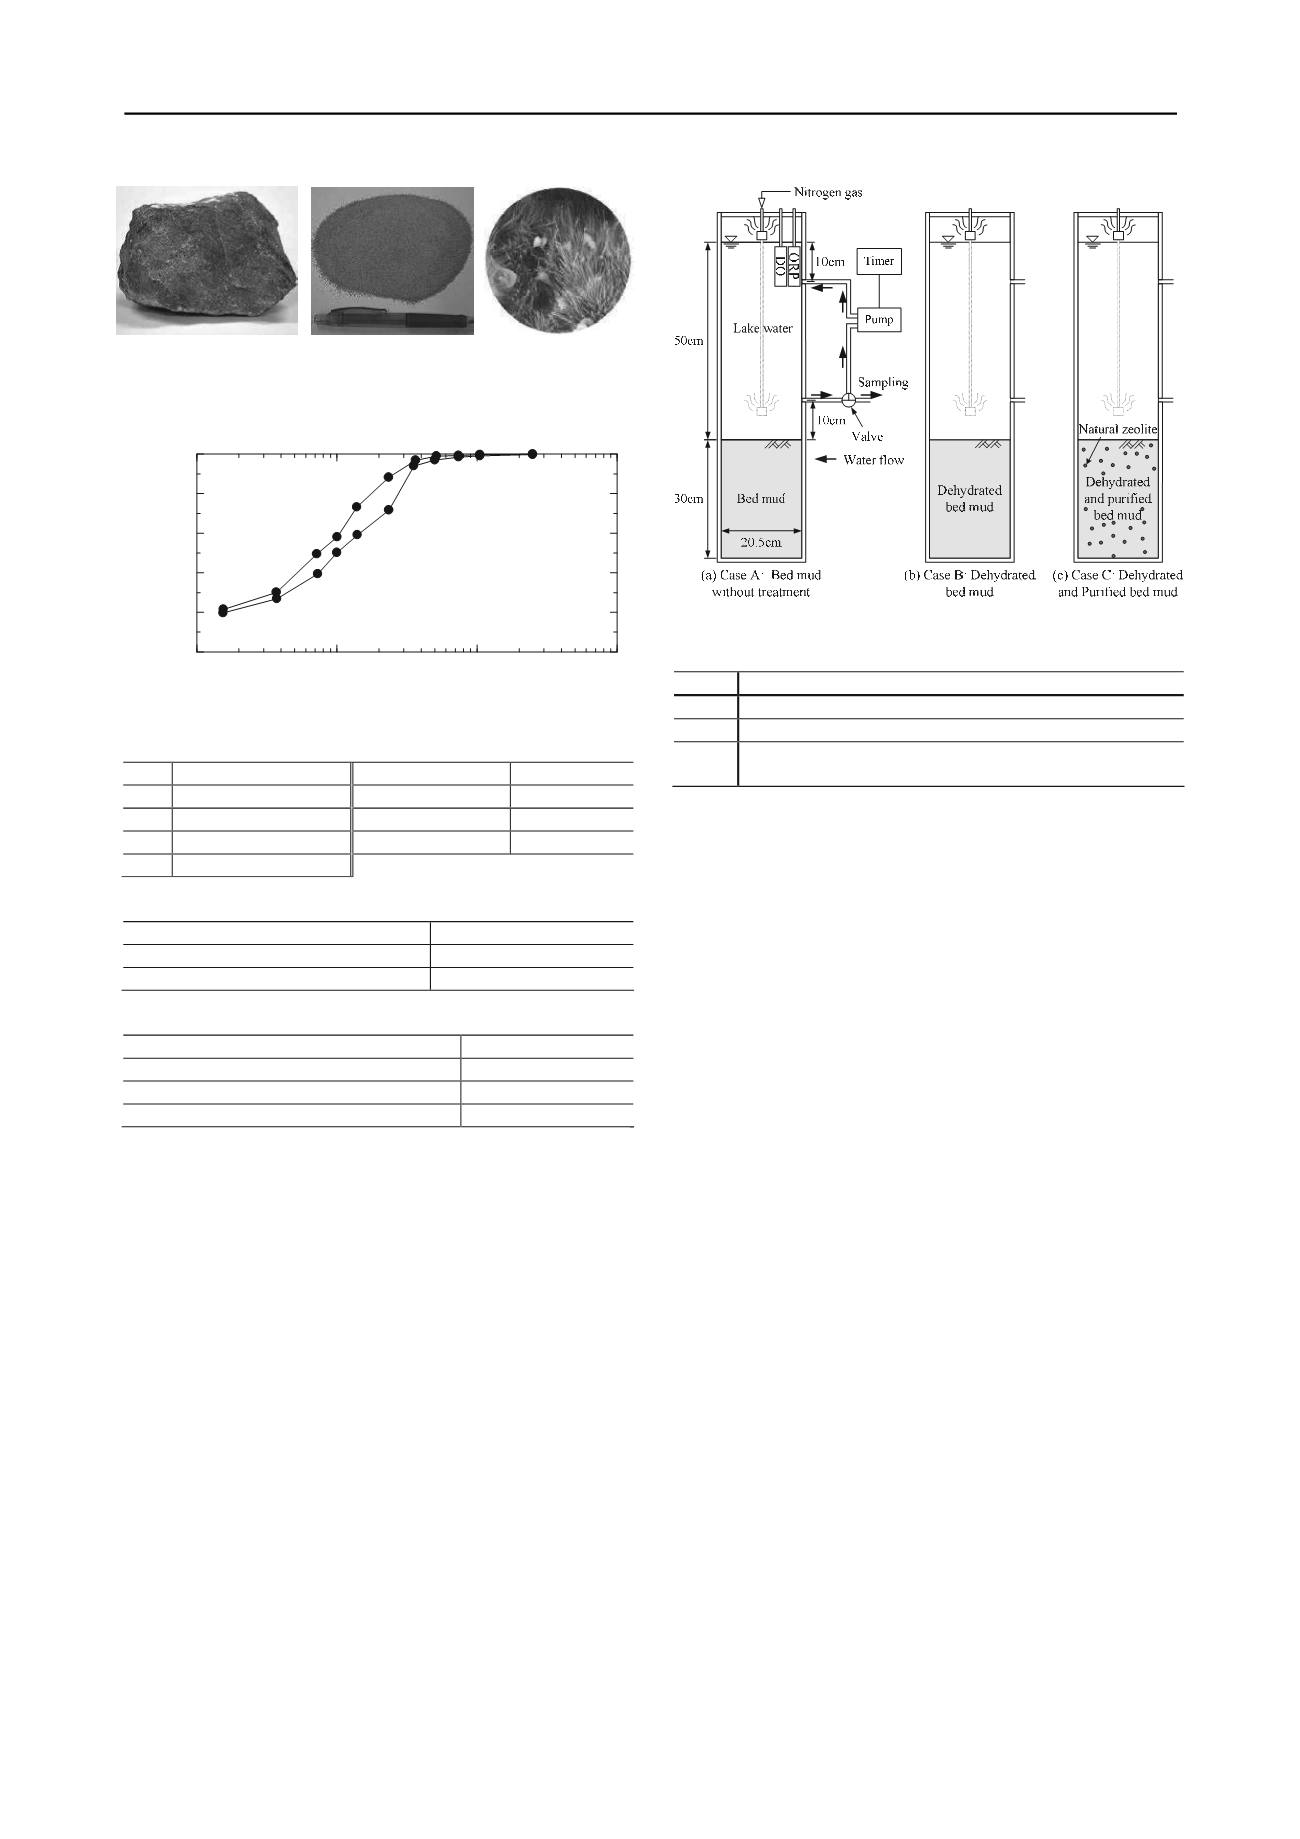
3.4
Column test for release of nutrient salts
Three column tests were conducted in reference to a manual of
the Japan Sediments Management Association (2003). The
outline and conditions of the test are presented in Figure 3 and
Table 4. The bed mud was filled to 30 cm height into the acrylic
cylinder with 20.5 cm inner diameter and 100 cm height.
Moreover, lake water was poured carefully to 50 cm on the bed
(a) Natural zeolite consists
primarily of mordenite
(b) Natural zeolite
powder (under 0.5 mm)
(c) Electron
micrograph
(MINDECO, 2012)
Photo 1. Natural zeolite (Shimane Prefecture, Japan).
0.001
0.01
0.1
1
0
20
40
60
80
100
Grain size (mm)
Percentage finer than
weight (%)
Bed mud in Lake Suwa
(
w
i
=255.0, 295.6%)
(log scale)
Figure 2. Grading curve of bed mud sampled in Lake Suwa.
Table 1. Physical properties of bed mud sampled in Lake Suwa.
w
i
255.0
–
295.6%
L
i
15.4
–
16.2%
s
2.520
–
2.582 g/cm
3
Clay fraction (%)
30
–
40%
w
L
155.0
–
165.0% Silt fraction (%)
58
–
69%
w
P
102.0
–
104.2% Sand fraction (%)
1
–
2%
I
P
53.0
–
61.3
Table 2. Nutrient salt contents of dry bed mud.
Total nitrogen, T-N
3990
–
4200 mg/kg
Total phosphorus, T-P
1800
–
2000 mg/kg
Ammonia nitrogen, NH
4
-N
248
–
258 mg/kg
Table 3. Nutrient salt contents of lake water.
Total nitrogen, T-N
0.48
–
0.52 mg/L
Total phosphorus, T-P
0.014
–
0.022 mg/L
Ammonia nitrogen, NH
4
-N
0.03
–
0.09 mg/L
Chemical Oxygen Demand, COD
2.8
–
3.8 mg/L
Figure 3. Column test apparatus and test conditions.
Table 4. Conditions of column tests.
Case
Test conditions
Case A Bed mud without treatment (water content,
w
i
=255.0%)
Case B Bed mud (
w
0
=160.3%) dehydrated by consolidation
Case C Bed mud (
w
0
=152.0%), to which was added 10% of natural
zeolite powder for dry mass and dehydrated by consolidation


