3063
Technical Committee 215 /
Comité technique 215
Proceedings of the 18
th
International Conference on Soil Mechanics and Geotechnical Engineering, Paris 2013
a
to evaluate the effect of
the
monitored up to 40 weeks.
easonal thermal cycles,
bsoils depending on the
ere a solid waste landfill is
and
SM
w
hermal Cycles
n of GCL2 from the
oisture content under
ooling
cycle on the GCL hydration. This led to an increase of the
mo
ation of
in turn the hydraulic
e level of constraint
the ratio of equilibrium
mo
om
Rayhani 2012) (w: equilibrium moisture content)
constant
temperatures induced by waste biodegradation, the hydration of
GCL samples while subjected to the constant temperatures of
Moreover, the normal stresses of 0, 0.5, 1, 2, 5, and 8 kP
were applied to some GCL specimens
normal stress on the GCL hydration.
3 RESULTS AND DISCUSSION
The evolution of GCL hydration was
In this paper, the effect of daily and s
elevated constant temperatures, and external loading as well as
the GCL manufacturing techniques and grain size distribution of
subsoil on GCL hydration is discussed.
3.1
Subsoil grain size distribution
GCLs are placed over different su
availability of the type of the soil wh
constructed. As mentioned earlier, the GCL hydration depends
on the water retention curves of both subsoil and the GCL
(Beddoe et al. 2011). In order to investigate this phenomenon,
the isothermal hydration progressions of GCL2 from four
different subsoils (SP, SM, SC, and CL) at 10% initial
gravimetric moisture content were juxtaposed for comparison
(Figure 3). GCL2 in close contact with clay subsoil stabilized
with the equilibrium gravimetric moisture content of 48% while
this value ranged between 79 to 88% for the other subsoils.
The rate of moisture uptake from the clay subsoil was also
found to be lower compared to the other subsoils (SP, SC,
). As shown in Figure 3, the gravimetric moisture content
after the first week for the GCL sample in close contact with
clay (13%) subsoil was less than the other sandy subsoils which
varied from 31% to 44%. This could be attributed to the fact
that the difference between the suction of the GCL and the
subsoil decreased as the portion of fine particles within the
subsoil increased which in turn induced lower rate of hydration
and equilibrium moisture content for the GCL.
Figure 3. Hydration response of GCL2 from different subsoils at
=10% initial moisture content (CL: Clay, SC: clayey sand, SM: silty
fdn
sand, SP: poorly graded sand)
3.2
Daily and Seasonal T
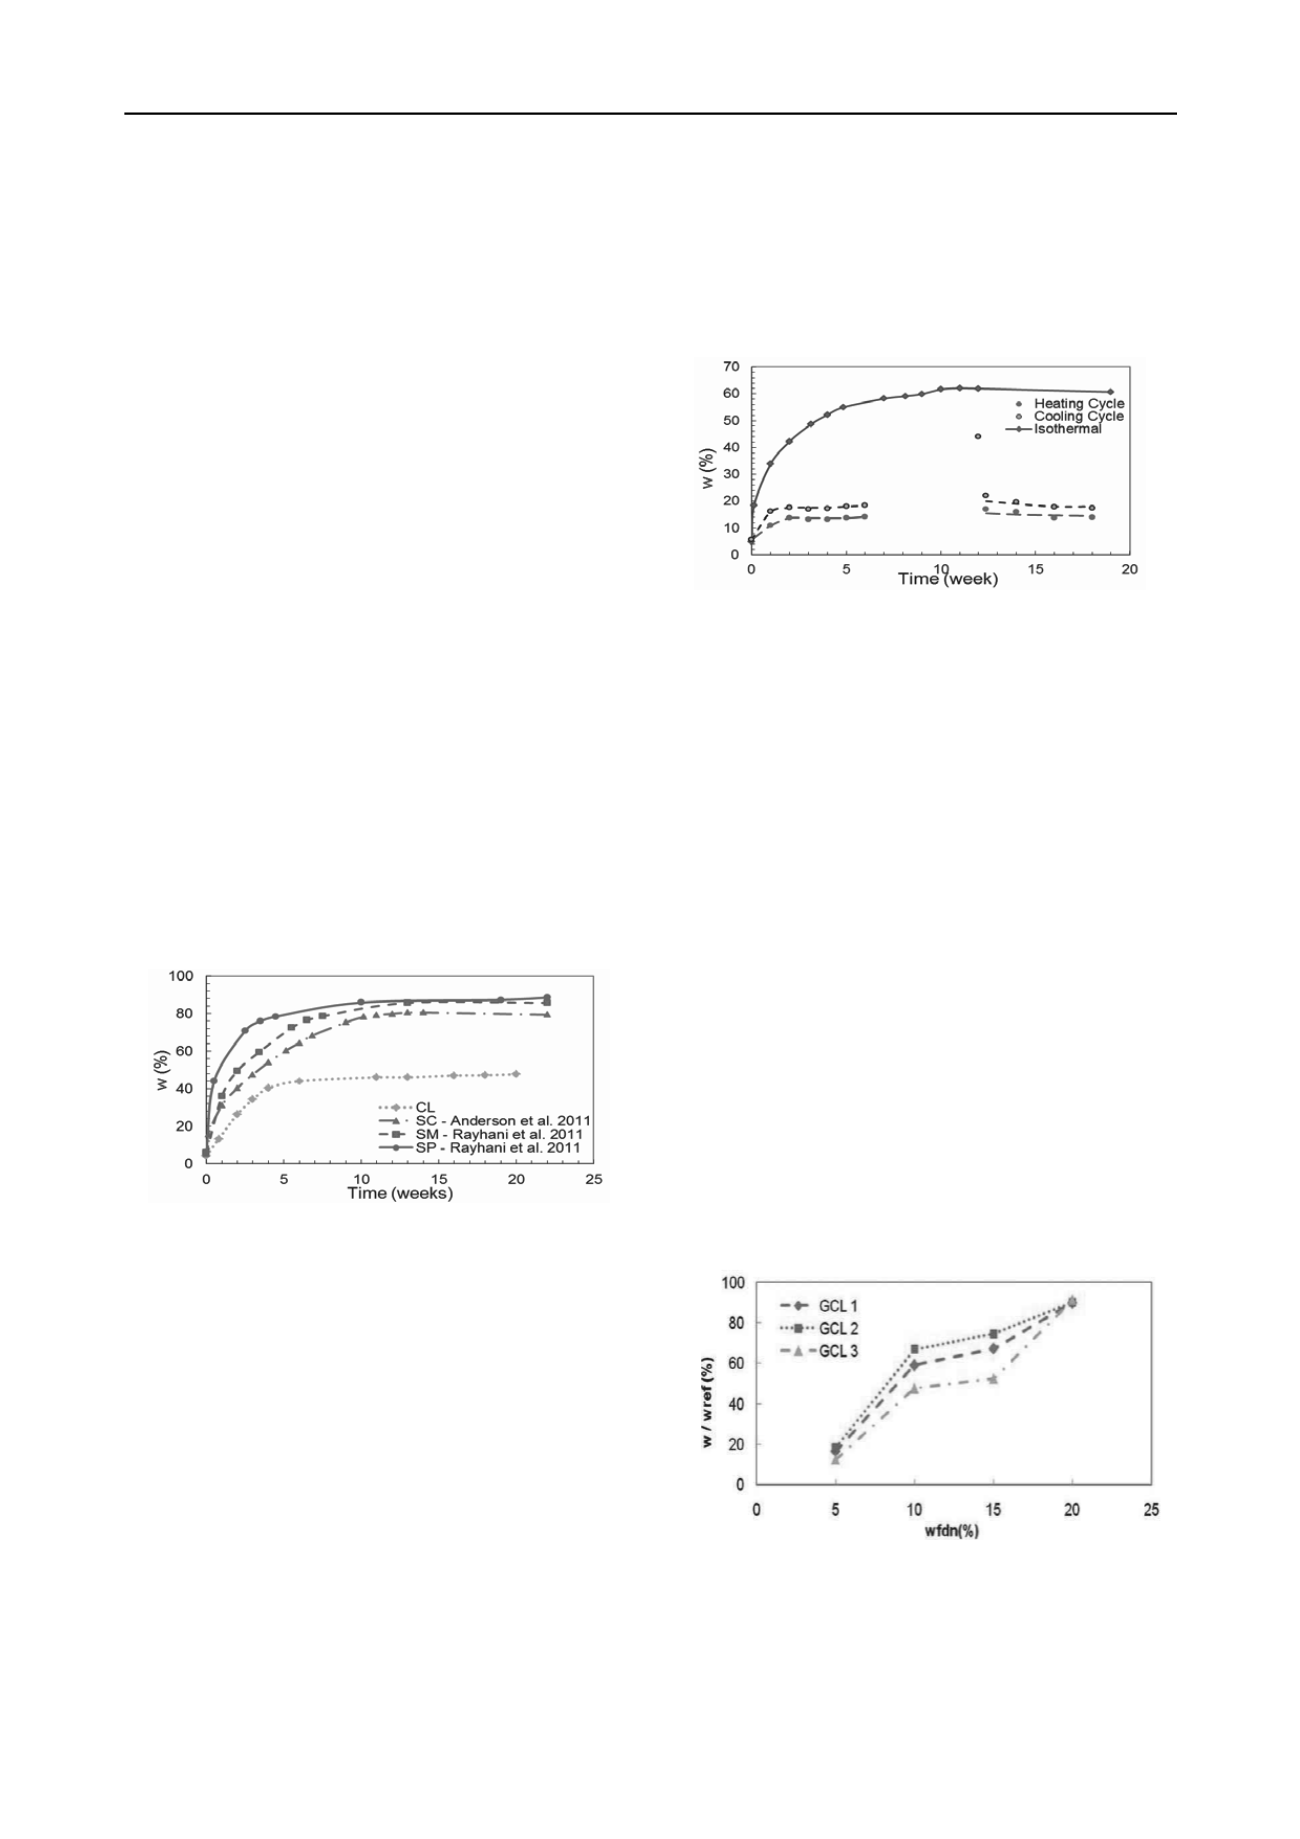
Figure 4 compares the hydration progressio
clay subsoil at 30% initial gravimetric m
the simulated daily thermal cycles with that of the isothermal
condition (22
C). The GCL sample stabilized at the equilibrium
gravimetric moisture content of 14% (week 6) while subjected
to daily thermal cycles. Comparatively, the same GCL
experienced the equilibrium moisture content of 61% under
isothermal condition. Similarly, the results for GCL3 indicated
that the equilibrium moisture content under thermal cycles was
approximately 15% of the moisture content expected under
isothermal conditions. As shown in Figure 4, a meager increase
of 5% in moisture content was observed after cooling in each
thermal cycle; however, the equilibrium moisture content under
the daily thermal cycle was significantly suppressed and was
much less than that attained under isothermal condition.
The daily thermal cycles were also stopped for a period of 6
weeks to simulate and evaluate the effect of seasonal c
isture content from 18% at the end of the daily thermal cycle
period (week 6) to 44% at the termination of the cooling period
(week 12). However, the moisture content of the GCL sample
dropped to its initial level as the thermal cycles resumed. This
shows that cooling periods followed by daily thermal cycles,
which could normally occur during winter, may not guarantee
the sustainable hydration of the GCL.
Figure 4. Effect of daily and seasonal thermal cycles on hydr
GCL2 (subsoil=CL, w
fdn
=30%) (Sarabiam and Rayhani, 2012)
3.3
GCL manufacturing techniques
GCL manufacturing process was shown to affect the swelling of
the bentonite upon hydration, and
conductivity of the GCL by controlling th
between the carrier and cover geotextiles (e.g. Lake and Rowe
2000, Beddoe et al. 2011). Particularly, Beddoe et al. 2011
reported that the type of the connection layer significantly
influenced the WRC of GCLs in low ranges of suctions (i.e.
high values of moisture content).
In order to compare the effect of GCL manufacturing
techniques on the degree of hydration of GCL, the normalized
equilibrium moisture content defined as
isture content of the GCL to its submerged moisture content
(w/w
ref
) was utilized. GCL3 demonstrated the least effective
anchorage of geotextiles inducing the least normalized
hydration values for all subsoil moisture contets. The
normalized equilibrium moisture content of GCL1 which was
thermally treated was 5-10% less than GCL2. GCL2 reached the
highest normalized moisture content and in turn degree of
hydration (Figure 5). The improved anchorage of the thermally
treated scrim-reinforced GCL provided less swelling and final
bulk void ratio which is expected to improve the hydraulic
performance. Moreover, there was a positive correlation
between the equilibrium moisture content of the GCL and the
subsoil initial moisture content due to higher levels of suction at
the GCL-subsoil interface in higher subsoil moisture contents
(Figure 5).
(Barclay and
Figure 5. Normalized moisture uptake (w/wref) for all GCLs fr
clayey sand (SC) subsoil with different initial moisture contents
3.4
Constant temperature
In order to investigate the effect of the high


