 
          3058
        
        
          Proceedings of the 18
        
        
          th
        
        
          International Conference on Soil Mechanics and Geotechnical Engineering, Paris 2013
        
        
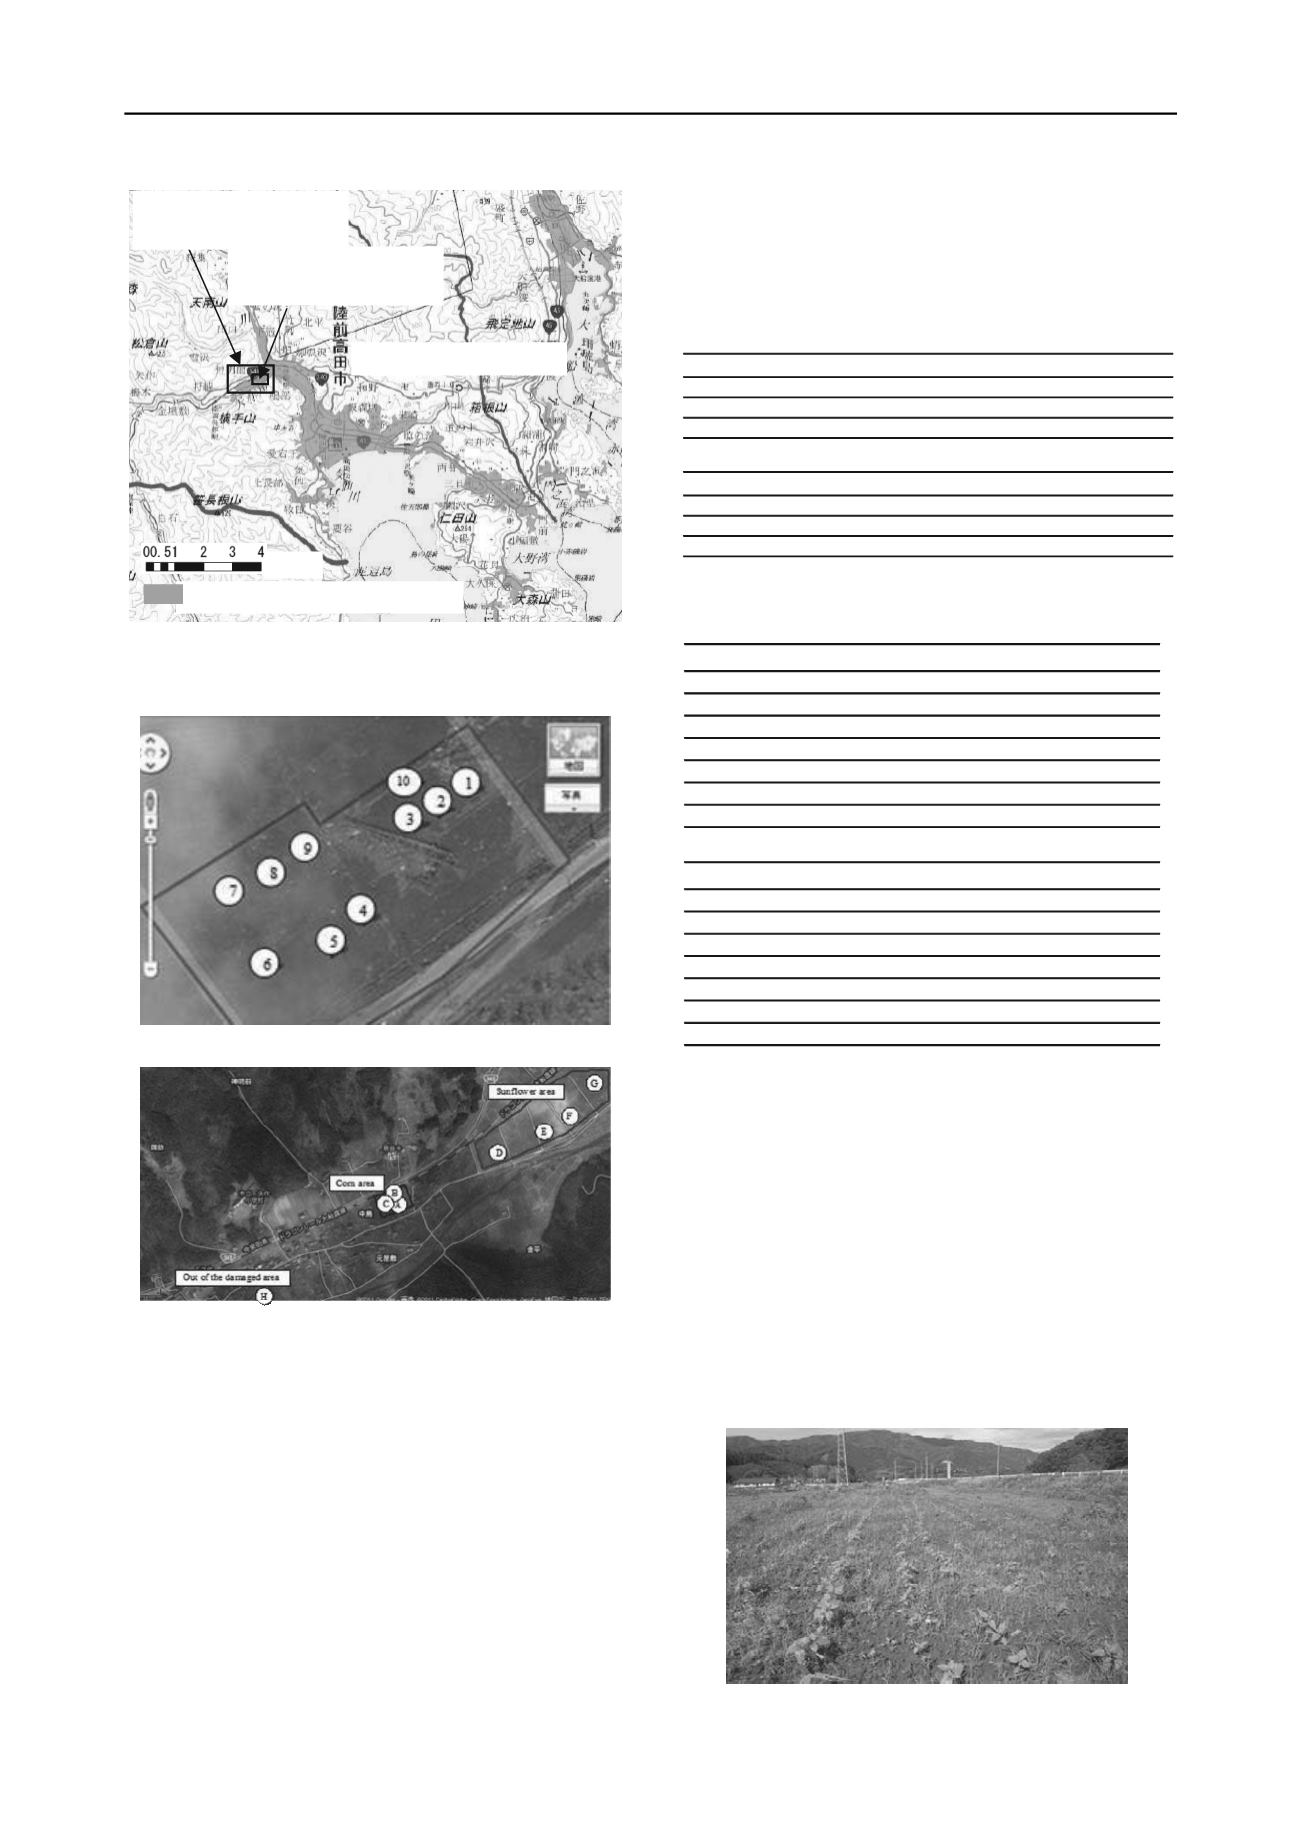
          Figure 1. The damaged area in Rikuzentakata city of Iwate Prefecture
        
        
          (The
        
        
          Geospatial
        
        
          Information
        
        
          Authority
        
        
          of
        
        
          Japan,


          )
        
        
          Figure 2. The place of investigation on 5 May 2011
        
        
          Figure 3. The place of investigation on 30 June 2011
        
        
          one of the major affected areas by the tsunami on 11 March
        
        
          2011. Figure 2 shows the place of soil investigation on 5 May
        
        
          2011 and Fig. 3 shows the place of investigation on 30 June
        
        
          2011. The sampling area shown in Fig. 1 corresponds to No. F
        
        
          in Fig. 2.
        
        
          The pH and electric conductivity (EC) of the damaged
        
        
          agricultural land were measured by a digital pH meter (Horiba,
        
        
          D-54SE). The EC of the soil was also measured by using digital
        
        
          an EC meter (Oakton, PCSTEST35). The salinity of the soil
        
        
          was calculated from EC. It is said that normal plants are
        
        
          affected by salt if soil EC exceeds 0.3-0.7 mS/cm. Some parts
        
        
          of the land showed very high EC on 5 May 2011. Table 1 shows
        
        
          the test result of EC and pH. There is the following empirical
        
        
          relationship between Cl (Chlorine) and EC;
        
        
          Cl content (mg/100g) = EC(mS/cm)×166
        
        
          The investigation on 30 June 2011 was done in a wide area
        
        
          including the place investigated on 5 March 2011. Table 2
        
        
          shows the test result of EC and pH. In Fig. 3, No. A~C is corn
        
        
          area, No. D~G is sunflower area and No. H is out of damaged
        
        
          area. The ECs of several soils were low, possibly due to the
        
        
          start of rainy season. Some soils however still showed high EC.
        
        
          Table 1. Electrical conductivity (EC) and pH of the soils measured on 5
        
        
          May 2011
        
        
          Depth 1 2 3 4 5 6 7 8 9 10
        
        
          5cm 1.51 0.36 0.39 1.49 1.26 0.47 1.20 1.77 1.01 0.25
        
        
          10cm 3.04 2.00 1.94 2.93 3.16 1.32 2.77 3.43 1.83 1.15
        
        
          15cm 2.23 2.43 2.81 4.03 2.21 1.84 0.97 3.46 2.4 2.25
        
        
          Depth 1 2 3 4 5 6 7 8 9 10
        
        
          5cm 7.21 8.47 8.06 7.55 7.22 8.39 7.71 7.62 7.19 8.27
        
        
          10cm 5.75 5.68 6.5 5.78 5.71 6.57 5.98 5.6 6.74 6.52
        
        
          15cm 6.22 5.48 5.69 5.2 6.13 5.84 7.12 5.64 5.77 5.82
        
        
          (a) EC (mS/cm)
        
        
          (b) pH
        
        
          Table 2. Chemical properties of the soils (30th June, 2011)
        
        
          Depth
        
        
          A B C D E F G H
        
        
          Surface
        
        
          0.56 0.11 0.13 0.083 0.09 0.064 0.13 -
        
        
          5 cm -
        
        
          -
        
        
          -
        
        
          -
        
        
          -
        
        
          -
        
        
          -
        
        
          0.032
        
        
          10 cm 0.97 1.19 0.62 -
        
        
          0.093 0.15 -
        
        
          -
        
        
          15 cm -
        
        
          -
        
        
          -
        
        
          -
        
        
          -
        
        
          -
        
        
          0.21 -
        
        
          20 cm 1.83 1.58 1.64 0.21 0.096 0.46
        
        
          0.026
        
        
          25 cm 2.15 -
        
        
          -
        
        
          -
        
        
          -
        
        
          -
        
        
          -
        
        
          -
        
        
          30 cm -
        
        
          -
        
        
          1.65 -
        
        
          -
        
        
          -
        
        
          -
        
        
          -
        
        
          Depth
        
        
          A B C D E F G H
        
        
          Surface
        
        
          7.2 8.1 7.4 8.3 9.0 8.4 8.0 -
        
        
          5 cm -
        
        
          -
        
        
          -
        
        
          -
        
        
          -
        
        
          -
        
        
          -
        
        
          6.9
        
        
          10 cm 6.6 5.9 6.7 -
        
        
          9.1 8.4 -
        
        
          -
        
        
          15 cm -
        
        
          -
        
        
          -
        
        
          -
        
        
          -
        
        
          -
        
        
          6.7 -
        
        
          20 cm 6.1 5.6 5.9 7.0 8.0 7.1 -
        
        
          6.9
        
        
          25 cm 6.4 -
        
        
          -
        
        
          -
        
        
          -
        
        
          -
        
        
          -
        
        
          -
        
        
          30 cm -
        
        
          -
        
        
          5.7 -
        
        
          -
        
        
          -
        
        
          -
        
        
          -
        
        
          (a) EC (mS/cm)
        
        
          (b) pH
        
        
          4 ATTEMPT OF RESTOATION OF AGRIGULTURAL
        
        
          LAND
        
        
          4.1


            Methods of Restoration


          The aim of soil salinity control is to prevent soil degradation by
        
        
          salinization and to reclaim already degraded soils. Various
        
        
          attempts are now being tested to control salinity of the
        
        
          agricultural land.
        
        
          The primary method of controlling soil salinity is to permit
        
        
          10-20% of irrigation water to leach through the soil; the leached
        
        
          water is then drained and discharged through an appropriate
        
        
          drainage system. The salt concentration of the drainage water
        
        
          normally becomes 5 to 10 times higher than that of the
        
        
          Figure 4. Growing sunflower at the agricultural land
        
        
          km
        
        
          Submerged area by Tsunami
        
        
          Rikuzentakata city
        
        
          Investigation area
        
        
          (5th March, 2011)
        
        
          Investigation area
        
        
          (30th Jume, 2011)