2673
Technical Committee 212 /
Comité technique 212
compatibility. The load was applied as pressure in small
increments till the load on the raft equal to the final test load.
Figure 3 shows the quarter model including finite element
meshing adopted in the analysis.
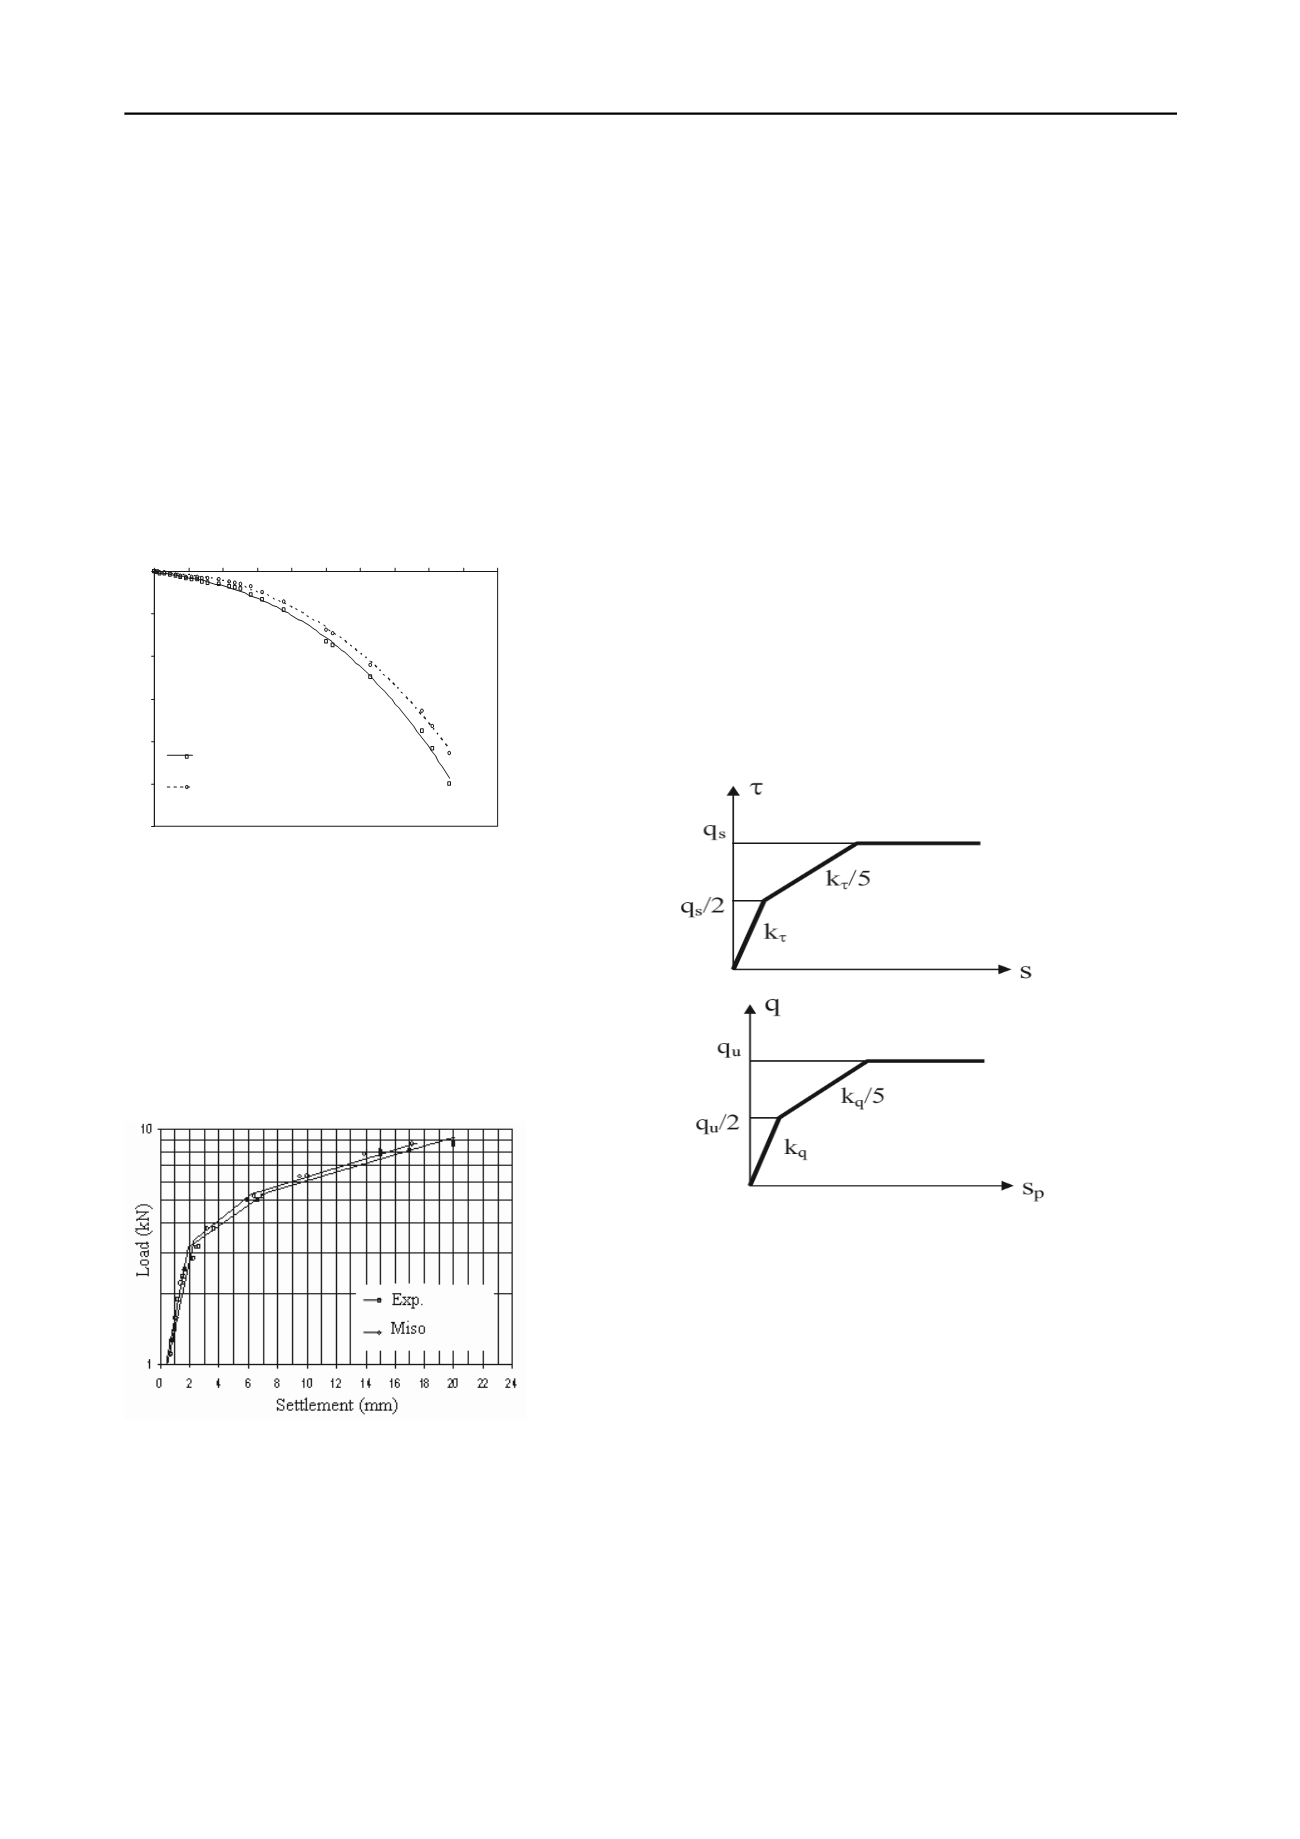
6. LOAD-SETTLEMENT BEHAVIOUR
Figure 4 presents the load settlement curves of circular piled raft
obtained from 1g model test and the numerical model. Figure 5
presents comparison of characteristic load-settlement response
of circular piled raft between experiment and numerical
analysis. The results obtained from the 1g model test and
numerical model agree very closely, till the settlement level of
4 mm.
0
4
8
12
16
20
24
0
1 2
3 4
5 6
7 8
9 10
LOAD, kN
SETTLEMENT, m m
EXPERIMENTAL
NUMERICAL - MISO
Figure 4. Comparison of Load-settlement
Figure 5. Characterisation Curves of Experimental and
Numerical Analysis
Figure 6. Tri-linear Model, Frank et al (1991)
As the load increases, the difference in the settlement
between the 1 g model and the numerical model results
increased marginally. However the maximum variation in the
load between the numerical model and the small scale model
results was less than of 5%. This comparison indicates a close
agreement between the numerical model and 1g model test.
Similar observation is made in the analyses of piled raft in loose
and dense sand. Thus the nonlinear analysis using MISO model
idealization for the soil predicts the performance of piled raft
reasonably well.
Although it has been established that the characterised load
settlement response predicted by analytical study and the 1g
model tests have agreed very closely, the basic parameter
namely the Es value of the soil was obtained from the direct
shear tests and the standard correlations available from the
literature The agreement in the results of 1g model and the
numerical analyses can be attributed to the fact that the
supporting medium was prepared under laboratory conditions.
However in the case of field samples the accuracy of the
parameters obtained largely depends upon the sampling
efficiency and the care taken in the extrusion of the specimen
and the preparation of test conditions. The probability of wide
variation while correlating the field data with the laboratory test
results cannot be ruled out. Therefore the evaluation of
parameters from the in-situ tests gain considerable
importance.A well tried procedure for predicting the shaft
friction development has been published by Roger Frank et al.,
(1991) using pressuremeter is discussed below.
7. PREDICTION OF PILE BEHAVIOUR.
PRESSSUREMETER AND ITS APPLICABILITY
The pressuremeter is an effective tool that has been extensively
used to obtain the in-situ parameters and for the last three
decades foundations have been designed based on the
parameters obtained from the in-situ tests. The large volume of
data collected over a period of time particularly the French
Highway authorities has enhanced the confidence level of the
designers in using them for the design of deep foundations.
Frank etal., (1991) have studied the load settlement response of
two piles forming a part of a bridge foundation. and had
established that their behaviour can be predicted by conducting
the pressuremeter test.Their prediction of pile behaviour is
based on a tri-linear relationship for the skin friction
mobilisation based on the pressuremeter tests The model they
had used is given in Figure 6.
The first segment has a constant slope .The slope of the
second line as more flat and third segment represents the
mobilisation of total skin friction. A typical tri-linear model of
shaft friction mobilisation. The end of the second part is the
limiting value of the friction .The evaluation of the friction is
done in their case based on LCPC-SETRA (1985) RULES. The
slopes of the lines depend upon the pressuremeter modulus and
radius of the pile. The prediction experimental load distribution
given by them has a similar trend as predicted by the numerical
analyses of the 1g model tests.
8. APPLICABILITY TO PILED RAFT DESIGN
Figure 7 and Figure 8 present the shaft stress distribution over
the length of the pile by pressuremeter test results and from the
numerical analyses of the 1g model tests. it is seen that the trend
of the shaft stress distribution obtained from both the cases
agree closely,indicating that the tri-linear model assumed in the
analyses of the pressuremeter results and the actual behaviour of
piled raft obtained from the 1g model are identical.


