2619
Technical Committee 211 /
Comité technique 211
S
c
= S
m
(1 + 2C
a
)
(1)
where S
c
is the shear strength of the mixture, S
m
is the shear
strength of the matrix, and C
a
is the area concentration of the
large cylinders in the mixture. The results of Fig. 5 and Eq. (1)
indicate that the overall shear strength of the simulated granular
mixtures increases with an increase in the number of the large
cylinders. Thus, in the case of real sand-gravel mixtures, it is
expected that the shear strength of these mixtures will increase
with the volume concentration of the gravel in the mixtures.
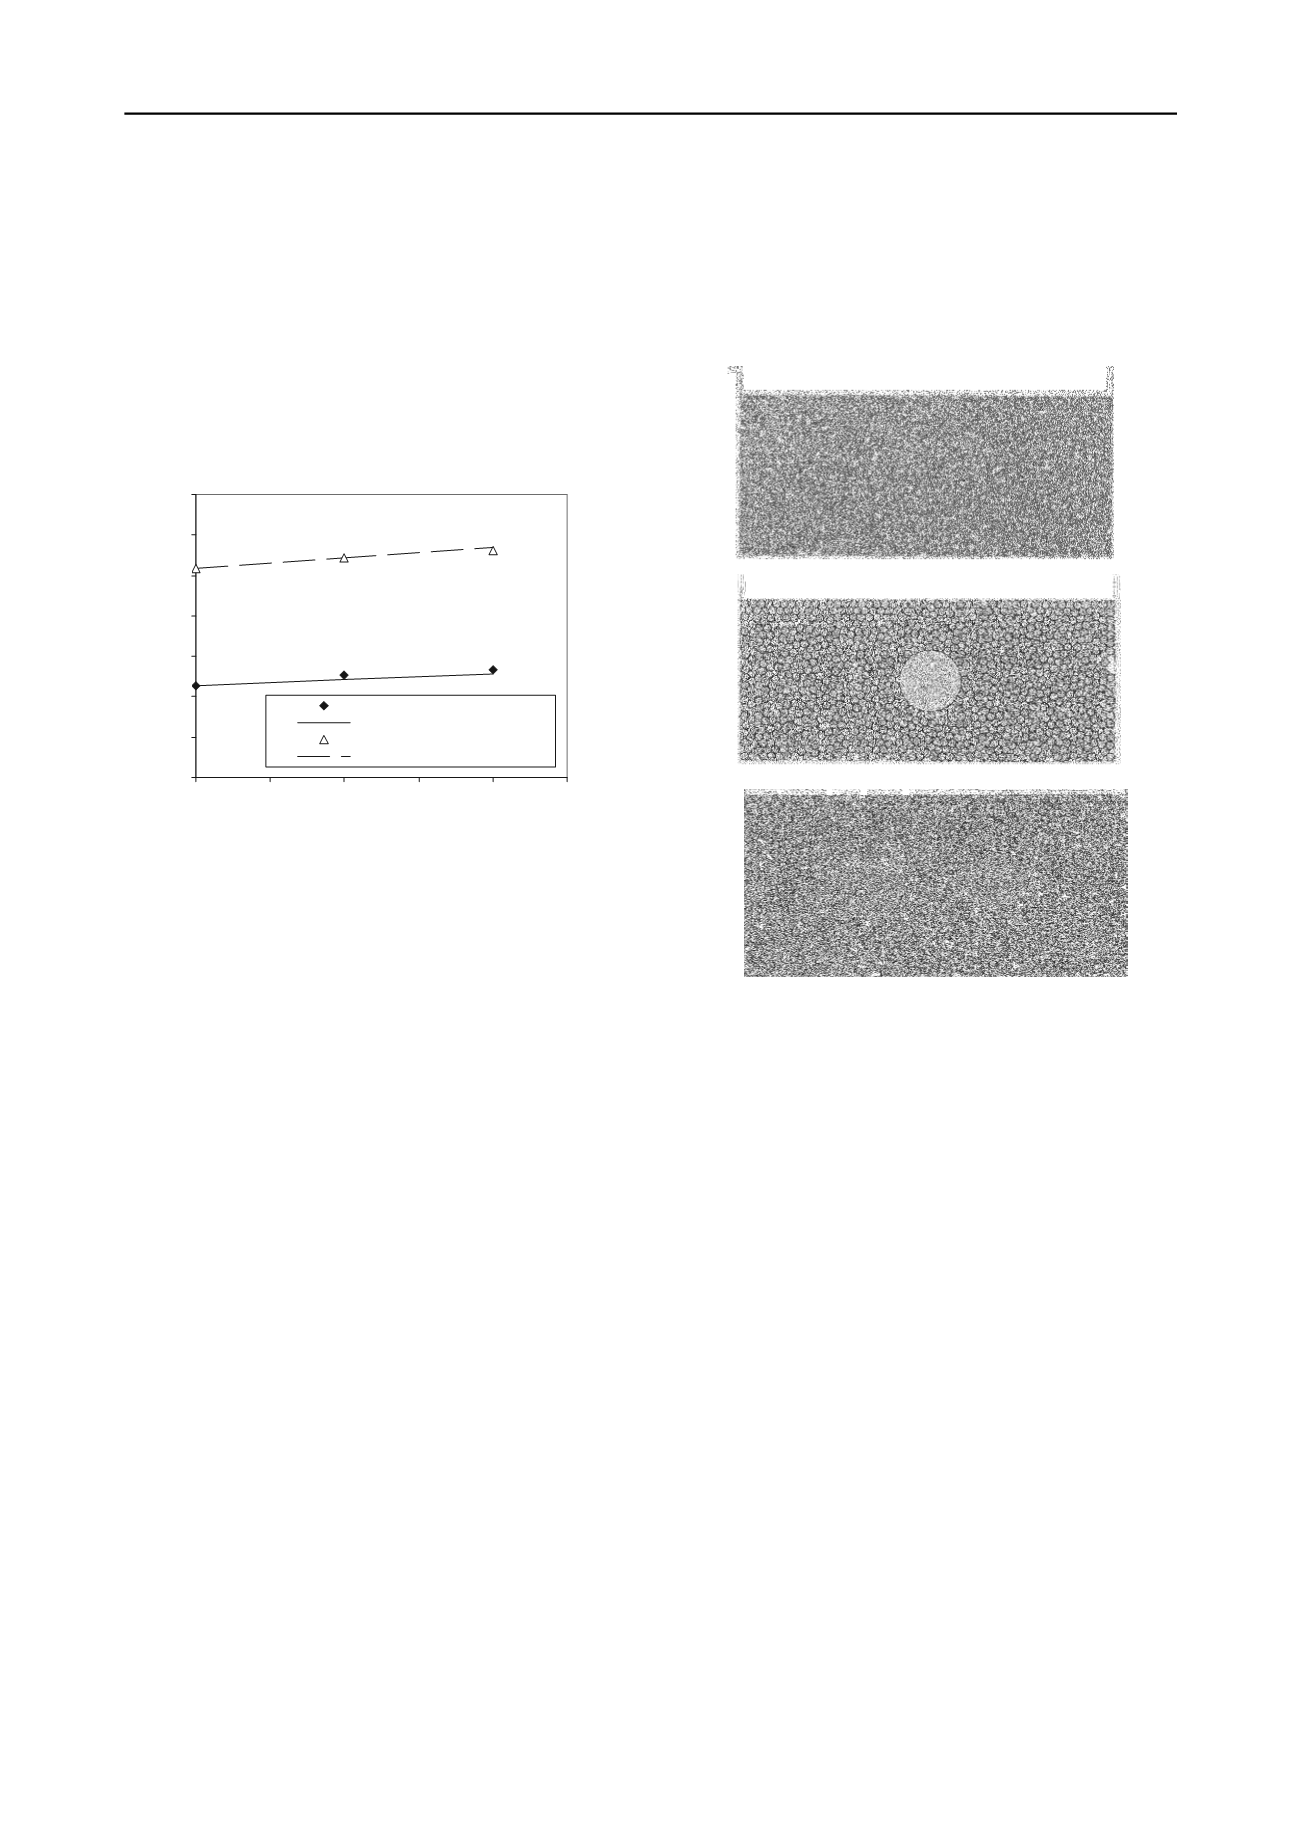
Figure 5.Shear strength of the simulated granular mixtures in function
of the area concentration of the large cylinders in the mixture.
3 ANALYSIS OF THE LABORATIRY RESULTS USING
THE DISCRETE ELEMENT METHOD (DEM)
3.1 Configuration of the samples
The PFC
2D
program produced by Itasca (Itasca Consulting
Group Inc., 2002) was used for the simulation of the direct
shear tests on granular material with dispersed oversized
particles. The first step on the configuration of the sample was
the construction of the shear box. The box had two sections
each with a width of 6 cm and a height of 1.5 cm. The two
sections were placed on top of each other and after the circular
particles were generated inside the box, the gap between the two
sections was maintained at 0.5 mm. The depth of the sample
was assumed to be equal to 1 m. The shear and normal stiffness
of the walls forming the box were set to 1x10
9
N/m. The
coefficient of friction between the circular particles and the
particles and the walls was set to 0.7.
After the construction of the box, 1000 particles representing
the granular matrix and having a diameter of 0.63 mm were
generated inside the box. The density of the particles was set to
2,500 kg/m
3
, their normal and shear stiffness were set to 1x10
8
N/m. Their positions were randomly chosen by the program,
having the limitation of no overlap between particles. A normal
gravity field (9.8 cm/sec
2
) was used during the simulation. In
order to simulate the dispersed oversized particles, 52 particles
of diameter equal to 0.63 mm were removed and replaced by an
oversize particle measuring 5 mm. If an additional oversize
particle was needed to be placed in the sample, the same
number of smaller particles were removed and replaced by
another large particle of 5 mm in diameter (Fig. 6). The tests
were run under a constant normal compressive load equal to
2x10
4
N. After the normal compressive force was applied to the
sample, the shearing started by moving the upper section of the
shear box to the left with a constant velocity of 0.44 mm/sec.
The tests ended when the horizontal displacement was equal to
5 mm. Also, using a subroutine available in the PFC
2D
code, one
can obtain the value of the shear stress in function of the
horizontal deformation. In this study, the peak shear resistance
that was measured in the simulationrepresents the shear strength
of the mixture.
Figure 6. Simulated samples using DEM that contained zero, one, and
two large dispersed particles.
3.2 Results of the simulations
The DEM simulations of the direct shear tests were carried out
on mixtures having zero, one, and two oversized particles. Figs
7 shows typical DEM results for the samples with zero, one and
three oversized particles. These figures shows the force chains
and their intensity (the thicker the force chains, the bigger are
the force chain value, their maximum values are shown on top
of the figures) for the samples with 3.5 mm of horizontal
displacement.
An analysis of Fig. 7 indicates that the larger force chains which
were compressive in nature were directed toward the large
particles and were transmitted to them by the smaller
surrounding particles. When the horizontal displacement in the
simulated test reached a 3.5 mm value, the force chains were
inclined at about 45 and 135 degrees with respect to the
horizontal axis of the cross sectional area of the large particles.
It is usually assumed that when samples of granular materials
with oversized particles are subjected to either compressive or
direct shear stress conditions, the smaller particles in the
mixture distribute the loads uniformly around the perimeter of
the bigger particles. This uniform load distribution produces
low compressive stresses on the bigger particles which allows
them to survive without breakage (Fragaszy et al., 1992). The
results shown by Fig.7 indicate that this is not the case. Under
direct shear, the smaller particles concentrate on the oversized
particles, large compressive forces that are exerted on a small
section of the perimeter of the large particles. These high
concentrated compressive forces exerted by the smaller particles
60
100
140
180
220
260
300
340
0
0.01
0.02
0.03
0.04
0.05
Area concentration, Ca
Shear strength (kPa)
Lab. results (99.6 kPa)
Sc = Sm(1+2Ca) ; 99.6kPa
Lab. results (199.3 kPa)
Sc= Sm(1+2Ca) ; 199.3 kPa


