2614
Proceedings of the 18
th
International Conference on Soil Mechanics and Geotechnical Engineering, Paris 2013
2.2
Curing method (nutrient injection process)
After saturation, 250 ml of microbial broth was injected into
each specimen. The microbial broth was made by planting
Sporosarcina pasteurii
in the medium described in Table 2.
After confirming that the broth had completely permeated the
specimen, 200 ml of the nutrient mixture described in Table 3
was injected into the specimen at 12 h intervals for specified
cycles.
Table 1. Physical properties of Toyoura sand
Soil
particle
density
s
(g/cm
3
)
Water
content
(%)
Max.
grain
diameter
(mm)
50%
diameter
on the
grain
size
diagram
D
50
(mm)
Fine
fraction
content
(%)
Max.
dry
density
d
max
(g/cm
3
)
Min.
dry
density
d
min
(g/cm
3
)
Soil
suspension
pH
2.623 0.0 0.425 0.177 0.6 1.645 1.333 6.3
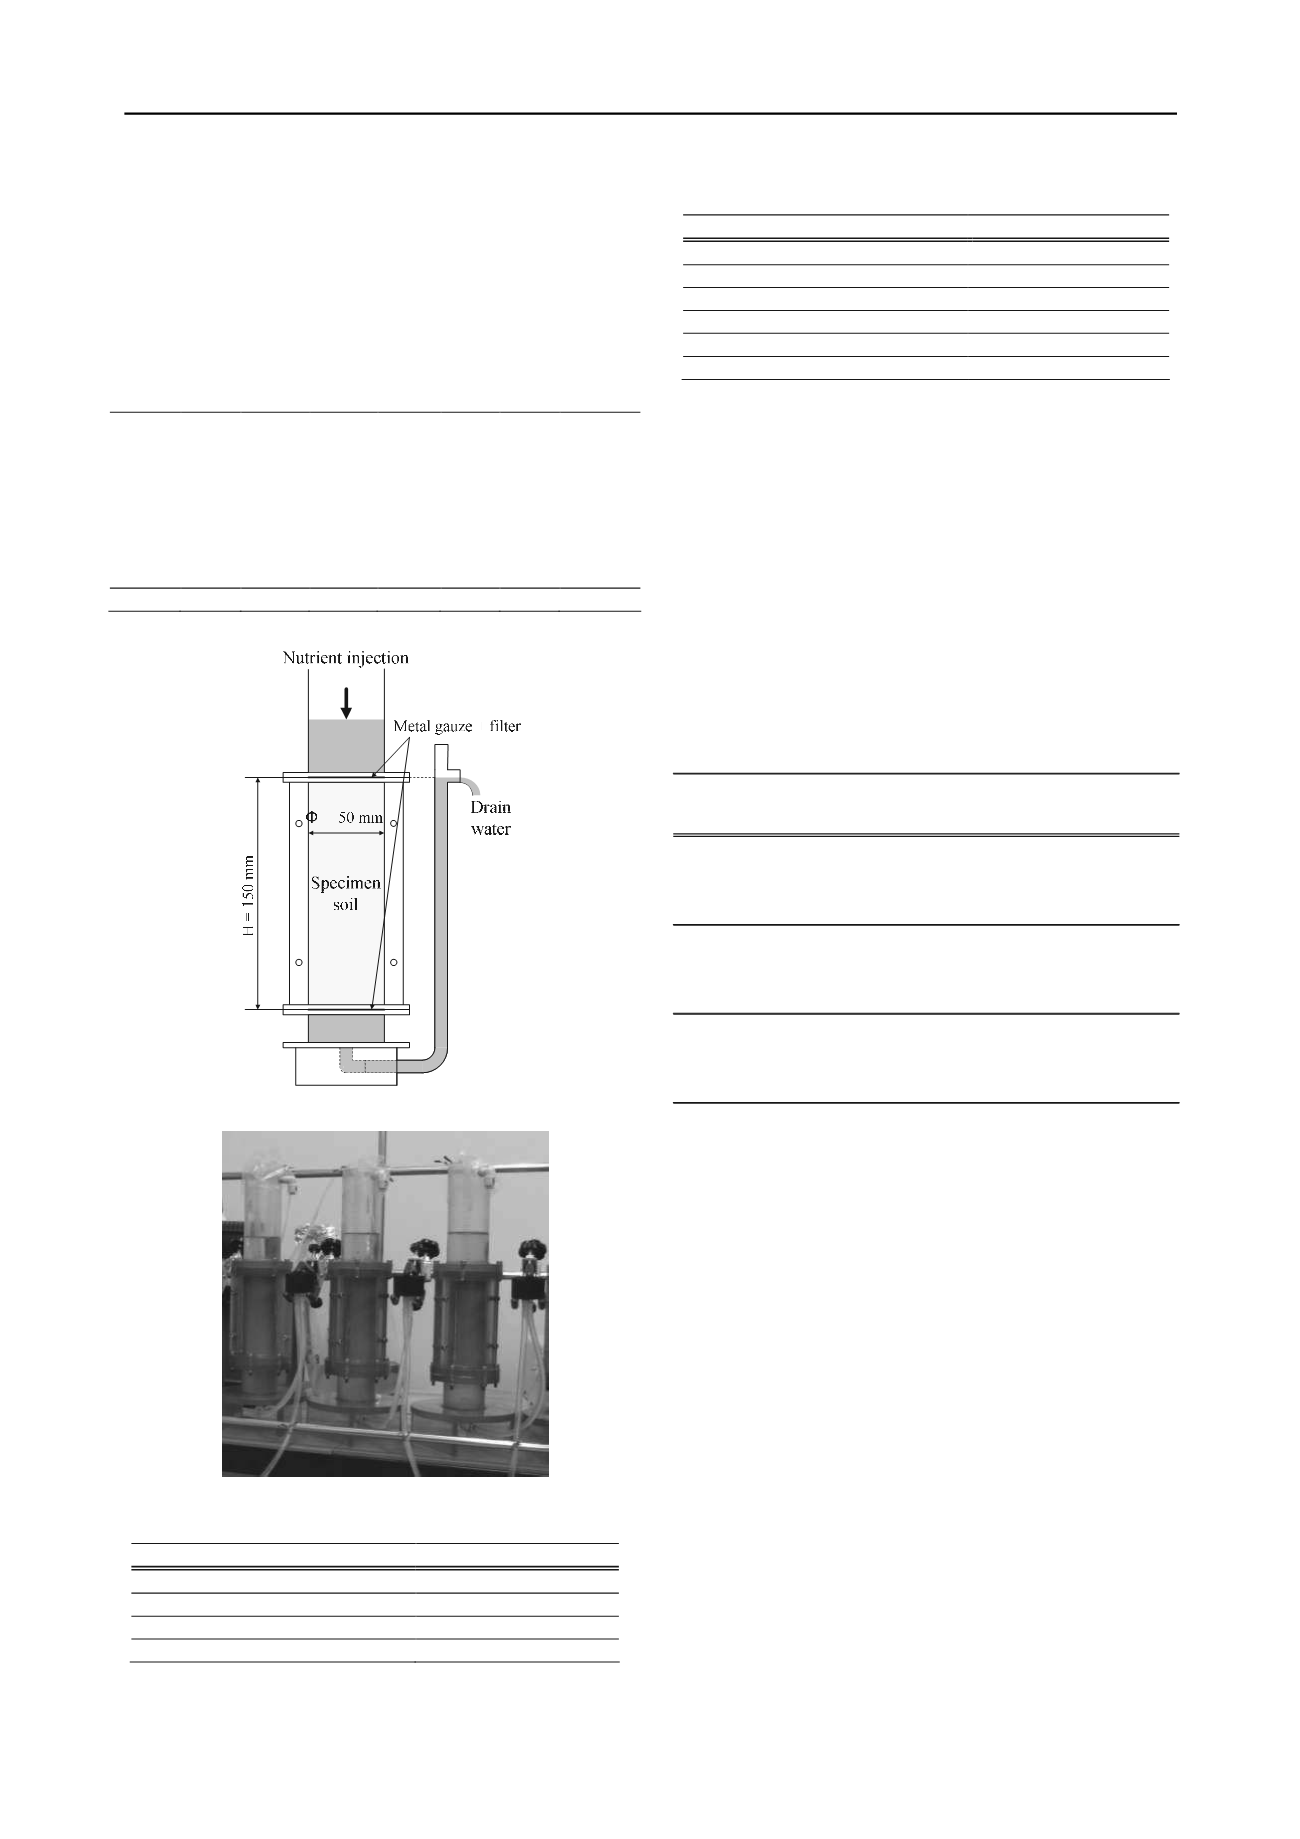
Figure 1. Schematic diagram of the mold
Photo 1. Photo of the mold
Table 2. Composition of medium
Name of reagent
Added amount
0.13 M Tris (pH = 9)
0.13 mol = 15.75 g
Yeast extract
20 g
(NH4)
2
SO
4
10 g
Distilled water
1 L
Table 3. Composition of nutrient mixture
Name of reagent
Added amount
Nutrient broth
3 g
NH
4
Cl
10 g
NaHCO
3
2.12 g
Urea
0.5 mol = 30.03 g
CaCl
2
0.5 mol = 55.49 g
Distilled water
1 L
The mold was cured in a room with a constant temperature
set at 22°C. The nutrient mixture that had been injected
previously and that remained in the pore was pushed out and
drained to maintain the saturated state of the specimen in the
mold.
Approximately 12 h after the specified cycles of nutrient
injection were completed, 300 ml of distilled water was injected
to wash away the nutrient mixture remaining in the pore.
As Table 4 shows, 15 specimens were made. The nutrient
mixture was injected into these specimens at various
frequencies in order to diversify the amount of CaCO
3
precipitation at each relative density. In addition, three
specimens were only saturated with distilled water, and not
injected with the broth and nutrient mixture, in order to examine
the strength of the Toyoura sand itself.
Table 4. Test cases
Initial dry
density
Initial
relative
density
CaCO
3
Precipitation
• •
d
(g/cm
3
)
Dr (%)
(kg/m
3
)
Dr30-N
―
―
1.423
33.2
―
Dr30-P1
2(400)
24
1.428
35.2
32.24
Dr30-P2
4(800)
48
1.414
30.2
63.72
Dr30-P3
8(1600)
96
1.416
30.8
141.92
Dr30-P4
12(2400)
144
1.414
30.4
225.53
Dr60-N
―
―
1.513
62.6
―
Dr60-P1
2(400)
24
1.504
59.9
28.11
Dr60-P2
4(800)
48
1.504
60.0
51.77
Dr60-P3
8(1600)
96
1.504
59.9
130.61
Dr60-P4
12(2400)
144
1.504
60.0
212.11
Dr85-N
―
―
1.589
84.9
―
Dr85-P1
2(400)
24
1.589
85.0
27.12
Dr85-P2
4(800)
48
1.589
85.0
57.38
Dr85-P3
8(1600)
96
1.589
84.9
117.13
Dr85-P4
12(2400)
144
1.589
85.0
198.55
Dr60
Dr85
Case Specimen
No.
Dr30
Frequency of
nutrient injection
(Total injection
amount ml)
Curing
time
(hours)
2.3
Triaxial test method
Triaxial tests (CD condition) were conducted using the
specimens produced by the method explained in 2.2. To reduce
disturbance caused by the demolding/shaping of specimens, the
specimens were frozen in the mold after the free water was
removed. The specimens that featured high CaCO
3
precipitation
were also frozen to equalize test conditions. The frozen
specimens were removed from the molds and shaped to 10 cm
in height and 5 cm in diameter. The shaped specimens were
measured to check the diameter and height and then placed in a
triaxial cell and defrosted under a negative pressure of 30 kPa.
The defrosting time was set at about 1.5 h, which was the
approximate time needed for stabilization of the axis
displacement caused by contraction in the process of defrosting.
We measured the diameter and the height of the defrosted
specimens, covered them with a cell cover, and saturated them
with degassed distilled water via the double-negative pressure
method. The back pressure was increased to 200 kPa, and
effective consolidation stresses of
c
’
= 100 kPa were applied
for isotropic consolidation. After consolidation, we confirmed
that the
B
values in all the specimens were 0.95 or higher. Then,
axial compression was performed at a strain rate of 0.5%/min.
The axial force was measured by the load cell inside the cell,
axial strain was measured by the displacement gauge outside the
cell, cell pressure and back pressure were measured by the
water pressure gauge, and the volume change was measured by
the low-capacity differential pressure gauge.


