2618
Proceedings of the 18
th
International Conference on Soil Mechanics and Geotechnical Engineering, Paris 2013
granular materials (Fig. 3) .The wooden sticks forming the
granular matrix will have 3 different average diameters. These
will be equal of 6, 4, and 2.7 mm. Thus, thegranular matrix as a
whole will be made of sticks having an average diameter equal
to 4.2 mm. The oversized large particles will be simulated by
rough wooden circular cylinders with a diameter equal to 12
mm. The irregular sticks as well as the circular cylinders have a
length equal to 25 mm. The mixture of wooden sticks and
cylinders were placed inside two U forms that comprise the box
in the Plane Stress Direct Shear apparatus (PSDSA)( Figs. 2 and
3). The area inside the two U forms is a square area with sides
measuring 7.6 cm in length. The open face of the shear
apparatus formed by the two U forms allows the recording of
the changes taken place in the mixture during shearing. Two
proving rings measure the normal and shear forces applied to
the mixtures. Dial gauges measure the normal and shear
displacements. The changes in fabric experienced by the
mixture as well as the interaction between the granular matrix
and the large particles during shear was recorded using digital
photographs of the open face of the PSDSA .
Figure 2. The Plane Stress Direct Shear Apparatus (PSDSA)
(Vallejo, 1991)
(a)
(b)
(c)
Figure 3. Simulated granular mixture in the PSDSA before shearing: (a)
sample with no oversized particles, (b) sample with one oversized
particle, (c) sample with two oversized particles.
2.2
Direct shear testing in the PSDSA
The simulated granular mixtures depicted in Fig. 3 were
subjected to shear in the PSDSA. The shear testing of the
mixtures were carried out using two normal stresses. These
were equal to 99.6 and 199.3 kPa. The rate of shearing of the
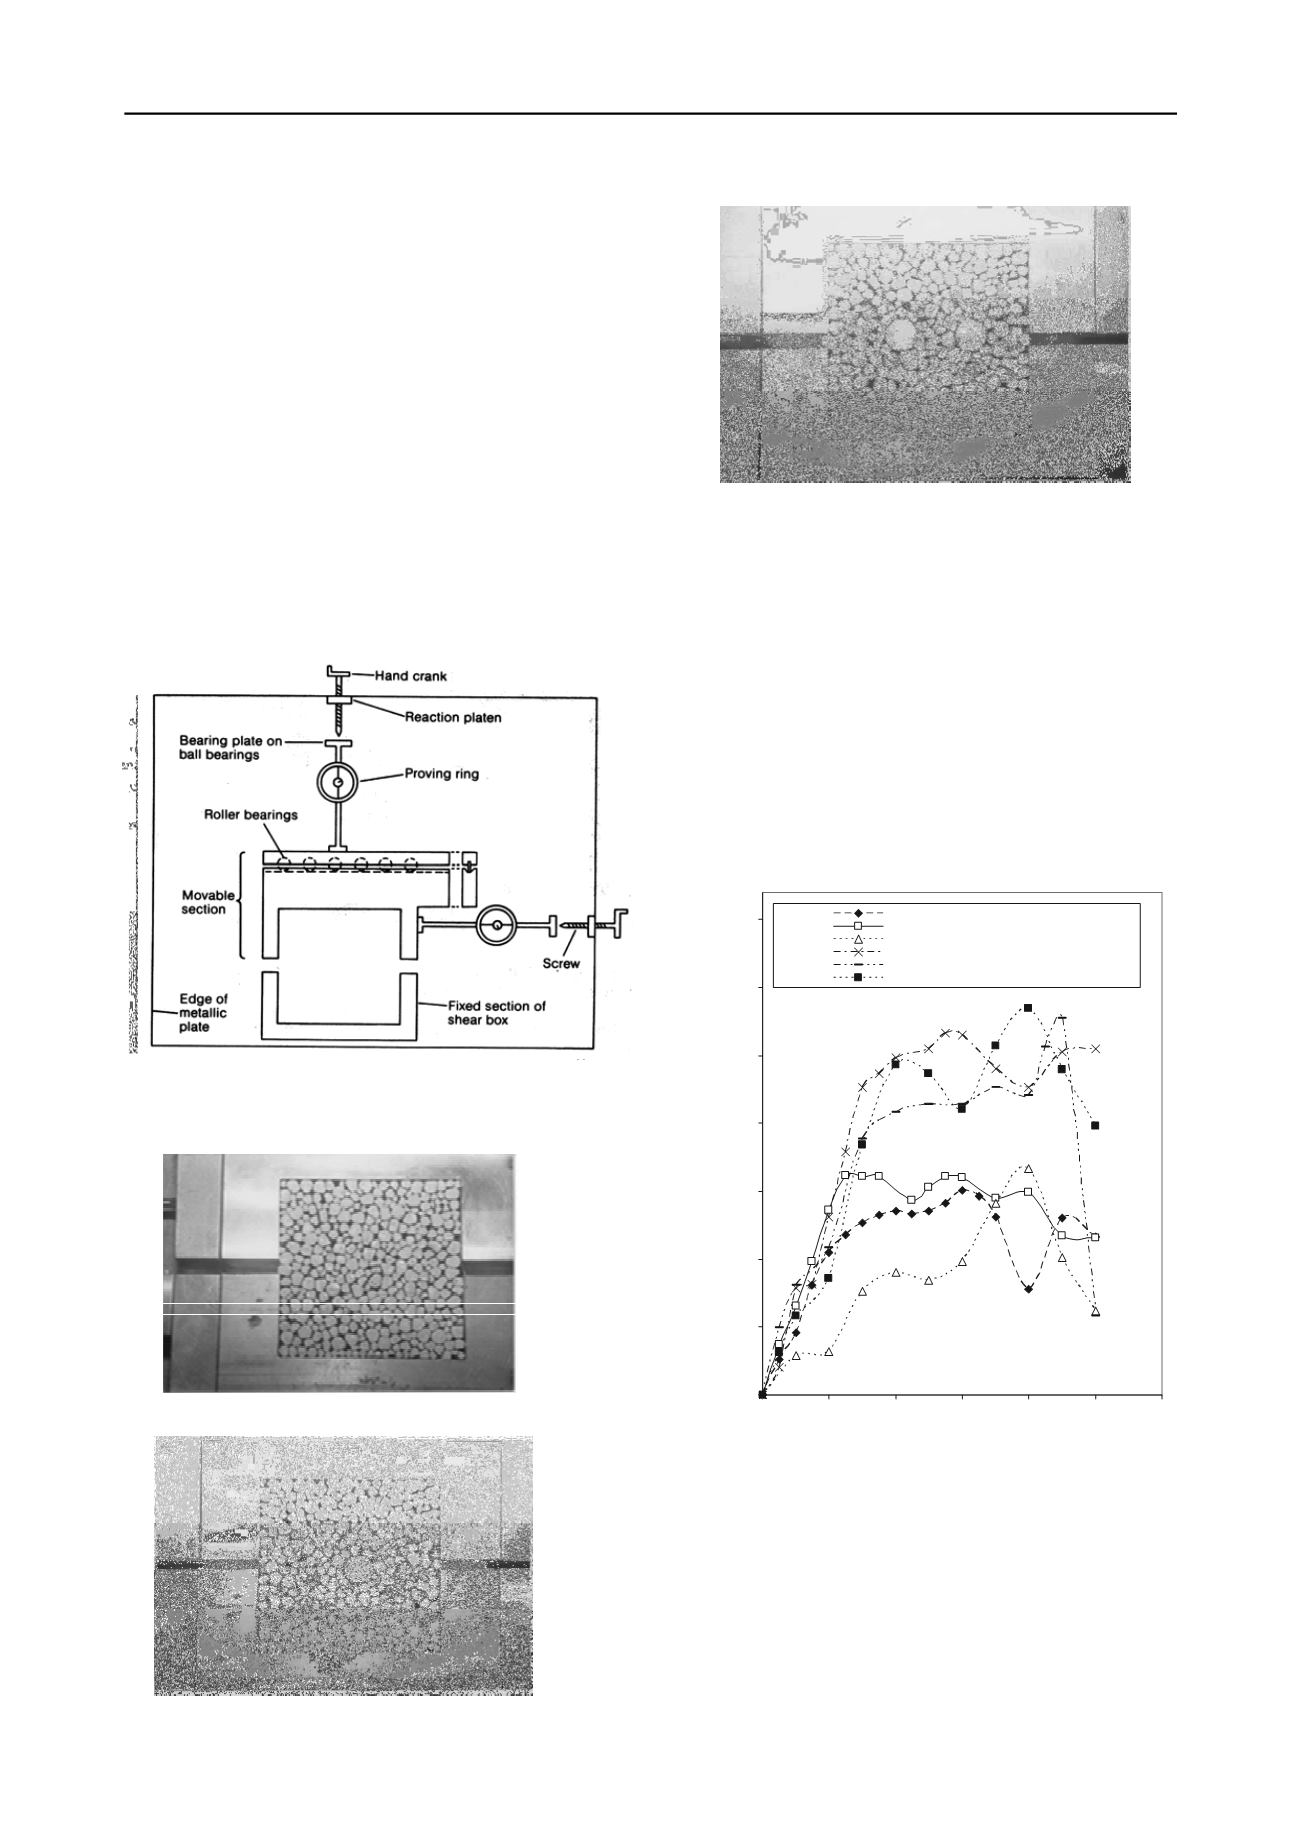
mixtures was equal to 2mm/min. Fig. 4 shows the shear stress
versus the horizontal displacement relationships for the sample
containing the matrix alone and the samples with one and two
12 mm in diameter cylinders representing the large particles
(Fig.3).
Figure 4. Shear stress versus horizontal displacement for the samples
tested in the PSDSA
The peak values of the shear stress plots of Fig. 4 have been
used to plot the shear strength versus the area concentration of
the large cylinders in the sample. This area concentration is
equal to the cross sectional area of the large cylinders in the
mixture divided by the area of the whole mixture (7.62 cm x
7.62 cm) (Fig. 3). The resulting plot is shown in Fig. 5. This
figure shows that the shear strength of the mixture increases as
the number of large cylinders increases in the mixture. An
equation that represents this increase is of the form:
0
50
100
150
200
250
300
350
0
0.02
0.04
0.06
0.08
0.1
0.12
Horizontal displacement (cm)
Shear stress (kPa)
Matrix (99.6kPa)
One oversized particle (99.6kPa)
Two oversized particles (99.6 kPa)
Matrix (199.3 kPa)
One oversized particle (199.3 kPa)
Two oversized particles (199.3kPa)
granular matrix will have 3 diff rent average diam ters. Th se
will b equal of 6, 4, and 2.7 m. Thus, thegranular matrix as a
whole will be made of sticks having an average diam ter equal
to 4.2 m. The oversized large particles will be simulated by
rough wooden circular cylinders with a diam ter equal to 12
m. The irregular sticks as well as the circular cylinders have a
length equal to 25 m. The mixture of wooden sticks and
cylinders w re placed inside two U forms that comprise the box
in the Plane Stress Direct Shear app ratus (PSDSA)( Figs. 2 and
3). The area inside the two U forms is a square area with sides
measuring 7.6 cm in length. The open face of the shear
app ratus formed by the two U forms allows the recording of
the changes taken place in the mixture during shearing. Two
proving rings measure the normal and shear forces applied to
the mixtures. Dial gauges measure the normal and shear
displacements. The changes in fabric experienced by the
mixture as well as the interaction between the granular matrix
and the large particles during shear was recor ed using d gital
ph tographs of the open face of the PSDSA .
Figure 2. The Plane Stress Direct Shear App ratus (PSDSA)
(Vallejo, 1991)
(a)
(b)
(c)
Figure 3. Simulated granular mixture in the PSDSA before shearing: (a)
sample with no oversized particles, (b) sample with one oversized
particle, (c) sampl with two oversized particles.
2.2
Direct shear testing in the PSDSA
The simulated granular mixtures depicted in Fig. 3 were
subjected to she r in the PSDSA. Th shear testing of the
mixtures wer carried out using two normal stresses. T se
were equal to 99.6 and 199.3 kPa. The ate of shearing of the
mixtures was equ l to 2mm/min Fig. 4 sh w the shear str ss
versu the horizon al displacement relationships for the ample
containing the m trix alon and th samples with one nd two
12 mm in diameter cylinders representing the large particles
(Fig.3).
0
50
100
150
200
250
300
350
0
0.02
0.04
0.06
0.08
0.1
0.12
Horizontal displacement (cm)
Shear stress (kPa)
Matrix (99.6kPa)
One oversized particle (99.6kPa)
Two oversized particles (99.6 kPa)
Matrix (199.3 kPa)
One oversized particle (199.3 kPa)
Two oversized particles (199.3kPa)
Figure 4. Shear stress versus horizontal displacement for the samples
test d in t PSDSA
The peak values of the shear stress plots of Fig. 4 have been
used to plot the shear tr ngth versus he area concentration of
the large cylind rs in the sample. This area concentration is
qual to the cro s section l ar a of the large cyli ders in the
mixture divided by he re of the whole mixture (7.62 cm x
7.62 cm) (Fig. 3). The resulting plot is shown in Fig. 5. This
figure shows that t shear strength of t e mixture increases as
the number of large cylinders increases n the mixture. An
quation that rep esents this increas i of the for :
S
c
= S
m
(1 + 2C
a
) (1)


