2615
Technical Committee 211 /
Comité technique 211
After the triaxial tests were completed, the specimens were
dried in a furnace and weighed, and the CaCO
3
precipitation in
each specimen was then obtained by measuring the decrease in
mass resulting from CaCO
3
decomposition by hydrochloric acid.
3 TEST RESULTS
3.1
Relationship between the amount of nutrient mixture
injected and the CaCO
3
precipitation
Figure 2 shows the relationship between the amount of nutrient
mixture injected and the CaCO
3
precipitation. The quantity of
CaCO
3
precipitation is given per unit volume of the test
specimen.
The tendency for CaCO
3
precipitation to increase as the
injections of the nutrient mixture increased can be confirmed for
each relative density. When the total injection of the nutrient
mixture is less than 800 ml, the differences among specimens
with different densities is unclear. When more than 800 ml of
the nutrient mixture is injected, the differences among the
specimens with different densities are observed. It is confirmed
that lower the relative density, the more CaCO
3
precipitates.
This is because the low relative density increases the amount of
microbes and nutrients absorbed by the test specimen.
0
50
100
150
200
250
0
500 1000 1500 2000 2500 3000
CaCO
3
precipitation (kg/m
3
)
Total amounts of nutrient injection (ml)
Dr = 30 %
Dr = 60 %
Dr = 85 %
Figure 2. Total amounts of nutrient mixture injected and CaCO
3
precipitation
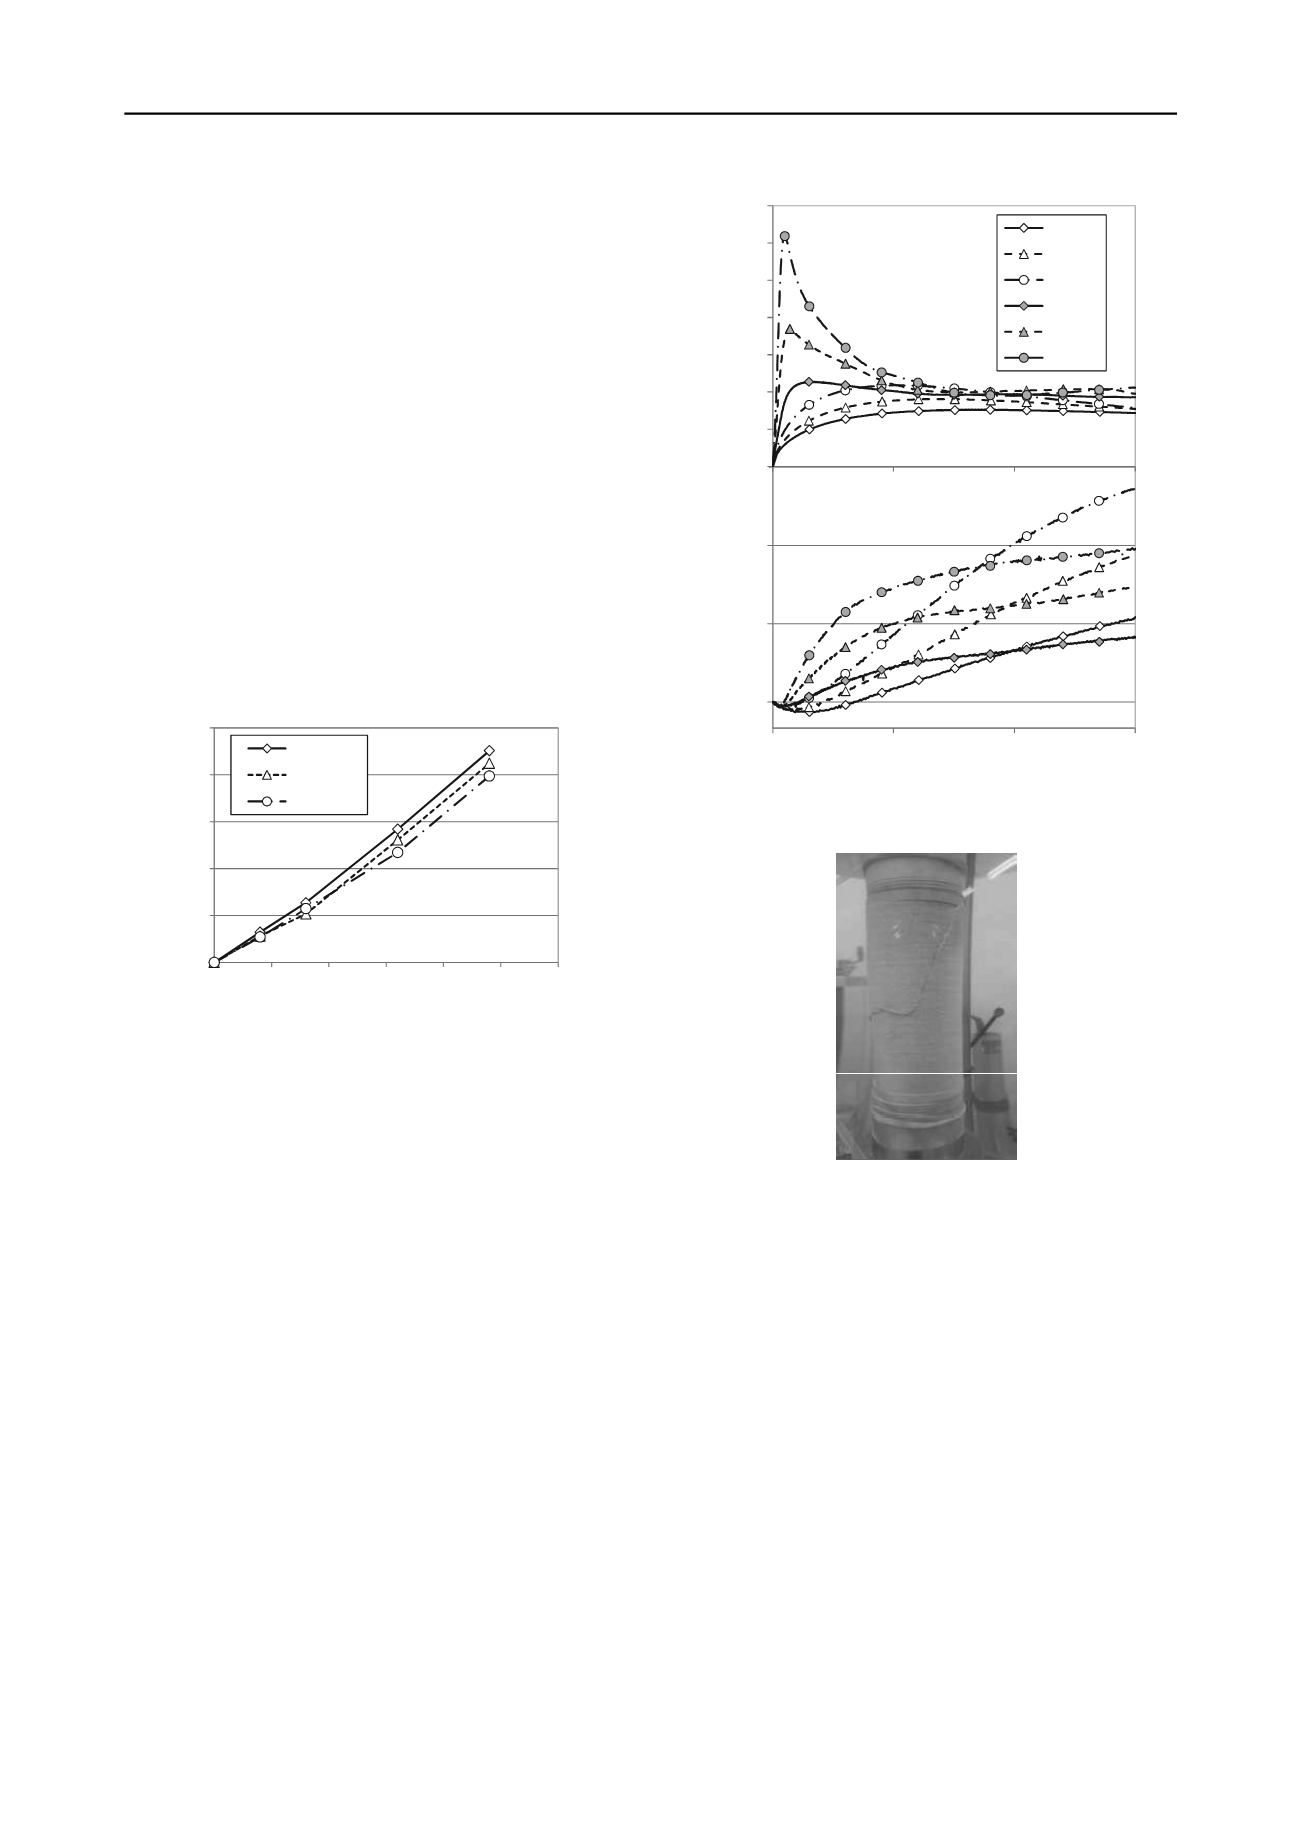
3.2
Relationships among axial strain, principal stress
difference, and volumetric strain
Figure 3 shows the principal stress difference
–
axial strain
curves and volumetric strain
–
axial strain curves. Toyoura sands
of each relative density saturated only with distilled water
(unsolidified) and those injected with 800 ml of the nutrient
mixture and CaCO
3
precipitation of 51.8
–
63.7 kg/m
3
are shown
in Fig. 3. Photo 2 shows the solidified test specimen after shear.
It can be confirmed that the solidification caused by the
CaCO
3
precipitation leads to an increase in the maximum
principal stress. In specimens with about the same CaCO
3
precipitation, the higher relative density of the soil, the increase
in the maximum principal stress difference is the greater. Strain
softening behavior is observed when the principal stress
difference reaches the maximum in the solidified test specimen.
A residual state occurs when axial stress reaches 5% or more;
then, the principal stress difference is constant at every relative
density, and its value shows no difference at each relative
density. It is thought that the principal stress difference becomes
equality in the residual domain because the test specimen is
sheared along the sliding surface. Photo 2 also shows a shearing
plane along the sliding surface. The increase in the volumetric
strain on the expansion side is confirmed clearly in the
solidified test specimens when the axial strain is small at each
relative density in comparison with the unsolidified test
specimens, and the ratio of increase becomes small around an
axial strain over 5%.
-9
-6
-3
0
0
5
10
15
Volumetric strain (%)
Axial strain (%)
0
200
400
600
800
1000
1200
1400
0
5
10
15
Principal stress difference (kN/m
2
)
Dr30-N
Dr60-N
Dr85-N
Dr30-P2
Dr60-P2
Dr85-P2
Figure 3.
Relationships among axial strain, principal stress difference,
and volumetric strain (
c
’
= 100 kPa)
Photo 2. Condition of the test specimen after shear
3.3
Relationship between CaCO
3
precipitation and maximum
principal stress difference
Figure 4 shows the relationship between CaCO
3
precipitation
and the maximum principal stress difference. There is no
change in the maximum principal stress difference when CaCO
3
precipitation is less than 30 kg/m
3
at each relative density. At
precipitation levels greater than 30 kg/m
3
, the maximum
principal stress difference increases monotonically depending
on CaCO
3
precipitation. The increase in strength is remarkable
in test specimens have higher relative density but little CaCO
3
precipitation. In the case of Dr = 85%, in comparison with Dr =
30% and Dr = 60%, the maximum principal stress difference
increases even as CaCO
3
precipitation stays at the same level.
3.4
Relationship between CaCO
3
precipitation and secant
modulus
Figure 5 shows the relationship between CaCO
3
precipitation
and the secant modulus. The secant modulus was calculated
from the principal stress difference at the axial strain of 0.4%.
At each relative density, there is little change when CaCO
3
precipitation is less than 30 kg/m
3
; however, when CaCO
3
precipitation is more than 30 kg/m
3
, the secant modulus
increases linearly according to the increase in CaCO
3
precipitation.


