2393
Technical Committee 209 /
Comité technique 209
Proceedings of the 18
th
International Conference on Soil Mechanics and Geotechnical Engineering, Paris 2013
In general the magnitude of the loading is seen to be a little
less than expected. This result verifies the importance of
measuring the actual force on the pile as some of the applied
load is lost in the system due to friction. For three of the tests
the cyclic load ratio,
, is seen to be close to zero which is in
agreement with the target loading.
In order to investigate the influence of cyclic loading on the
ultimate lateral resistance static loading tests were performed
after the cyclic loading.
2.1
Soil Conditions
The tests are conducted using saturated Aalborg University
Sand No. 1 (Baskarp Sand No.15). In Table 3 the properties of
the sand are summarised.
Table 3. Properties of Aalborg University Sand No. 1
Specific
grain density
Maximum
void ratio
Minimum
void ratio
50%-
quantile
Uniformity
coefficient
=
/
(-)
(-)
(-)
(mm)
(-)
2.64
0.858
0.549
0.14
1.78
Prior to each test the sand is prepared by use of an initially
upward gradient of 0.9 followed by mechanical vibration with a
rod vibrator. The obtained homogeneity and compaction of the
sand is verified by conducting three cone penetration tests
(CPT) with a laboratory cone; one in the middle of the container
and two in a distance 400 mm from the centre in the active and
passive side of the pile, respectively. The relative densities of
the sand,
, are derived in accordance to Ibsen et. al (2009)
where the laboratory cone is correlated with in-house triaxial
tests on the same sand type. The mean values of the relative
densities found prior to each experiment are presented in
Table 2 together with the characteristic of the tests themselves.
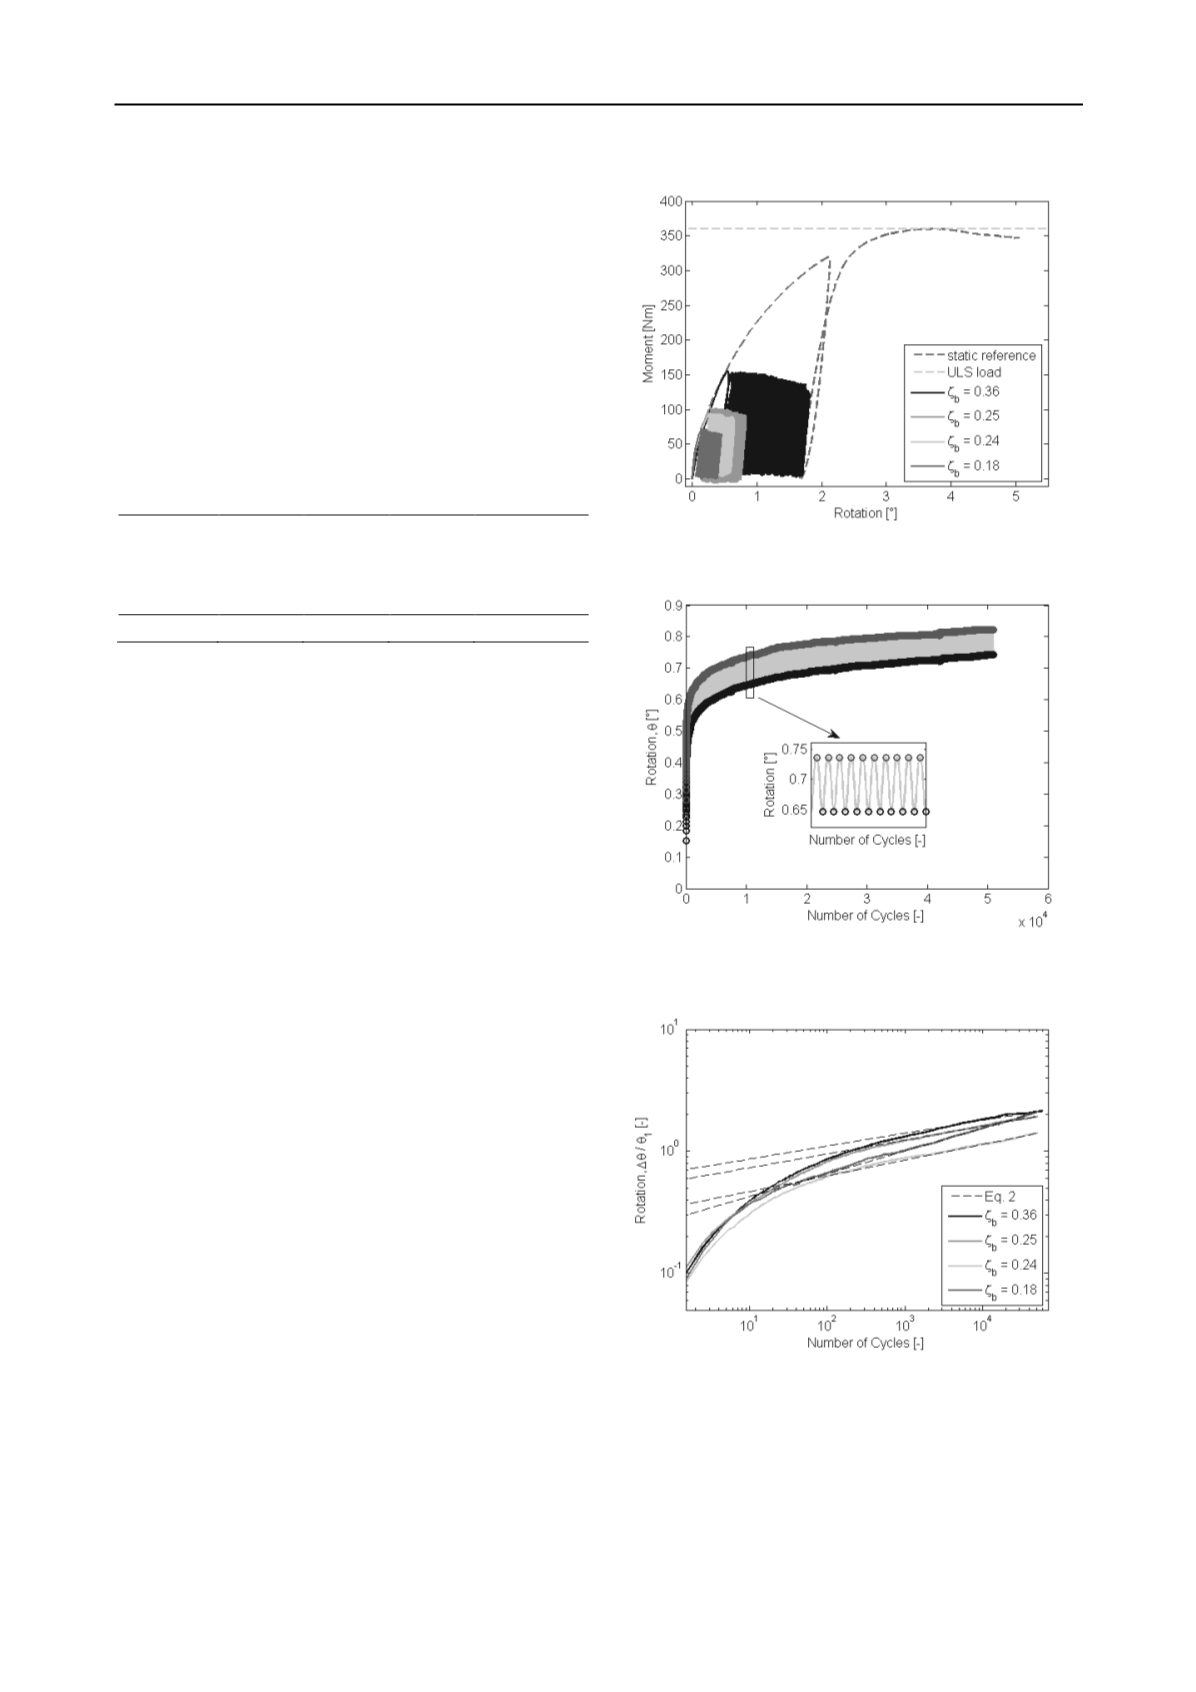
3 TEST RESULTS
Initially, the static loading test is used as a reference test for the
ULS moment capacity and thus the choice of maximum
moment loading in the cyclic tests. The moment-rotation
relationships obtained in both the static and the cyclic tests are
presented in Figure 3. The static test clearly defines a maximum
moment capacity of 360 Nm which is interpreted as the ULS
load. In all the cyclic tests the rotation obtained in the first
loading cycle follows the static reference test cf. Figure 3. This
verifies the use of the static test as a reference for the loading
despite the difference in relative densities of the soil cf. Table 2.
Even though the cyclic loading system is an improvement of the
system presented in Roesen et al. (2012) the maximum moment
loading in the cyclic tests are seen to decrease a little during the
test. Therefore, the characteristics of the cyclic loading,
and
cf. Table 2, are calculated as mean values over the whole test
and
is seen to be lower than the target value.
In Figure 4 the rotation of the pile,
, at soil surface as a
function of the number of cycles,
, for test no. 2 is presented.
The figure shows the cyclic response during loading and the
rotation is seen to accumulate throughout the entire test. Similar
results are obtained in the three other tests. In the evaluation of
the accumulated rotation the maximum values of the rotation
are used, i.e. the rotation marked with dark grey in Figure 4. As
seen in Figure 3 the rotation in the first loading cycle is equal to
the rotation obtained in the static reference test. Thus, in order
to evaluate the influence of the cyclic loading only the
accumulated rotation,
Δ =
−
, is investigated.
is
the rotation obtained at the
th
loading cycle and
is the
rotation obtained in the first loading cycle.
Figure 3. Moment-rotation relationships of the static reference test and
the four cyclic loading tests.
Figure 4. Rotation of the pile at soil surface as a function of the number
of cycles in the test with
= 0.25
. Maximum and minimum values of
the rotation are indicated by dark grey and black colouring.
Figure 5. Normalised accumulated rotation as a function of the number
of cycles for the four cyclic tests.
In Figure 5 the accumulated rotation obtained in all four
cyclic tests are presented. The rotations are normalised with
respect to the rotation obtained in the first loading cycle. The
accumulated rotations of the stiff pile are fitted with a power
function as suggested by several authors, e.g. Long and
Vanneste (1994), Peralta and Achmus (2010), and LeBlanc et
al. (2010). The fitted expression is given by Eq. 2 and shown as
the dotted black lines in Figure 5.


