2401
Technical Committee 209 /
Comité technique 209
silty sand, a normal consolidation stress of 100 KPa was applied
in one step for all the specimens.
1.4
Cyclic Direct Simple Shear test results
Several researchers have used different shear strain failure
criteria such as 3%, 4%, 5% and 7.5%. A shear strain failure
condition was used for tests performed on marine silty sand and
the failure criterion was established as 4% double amplitude
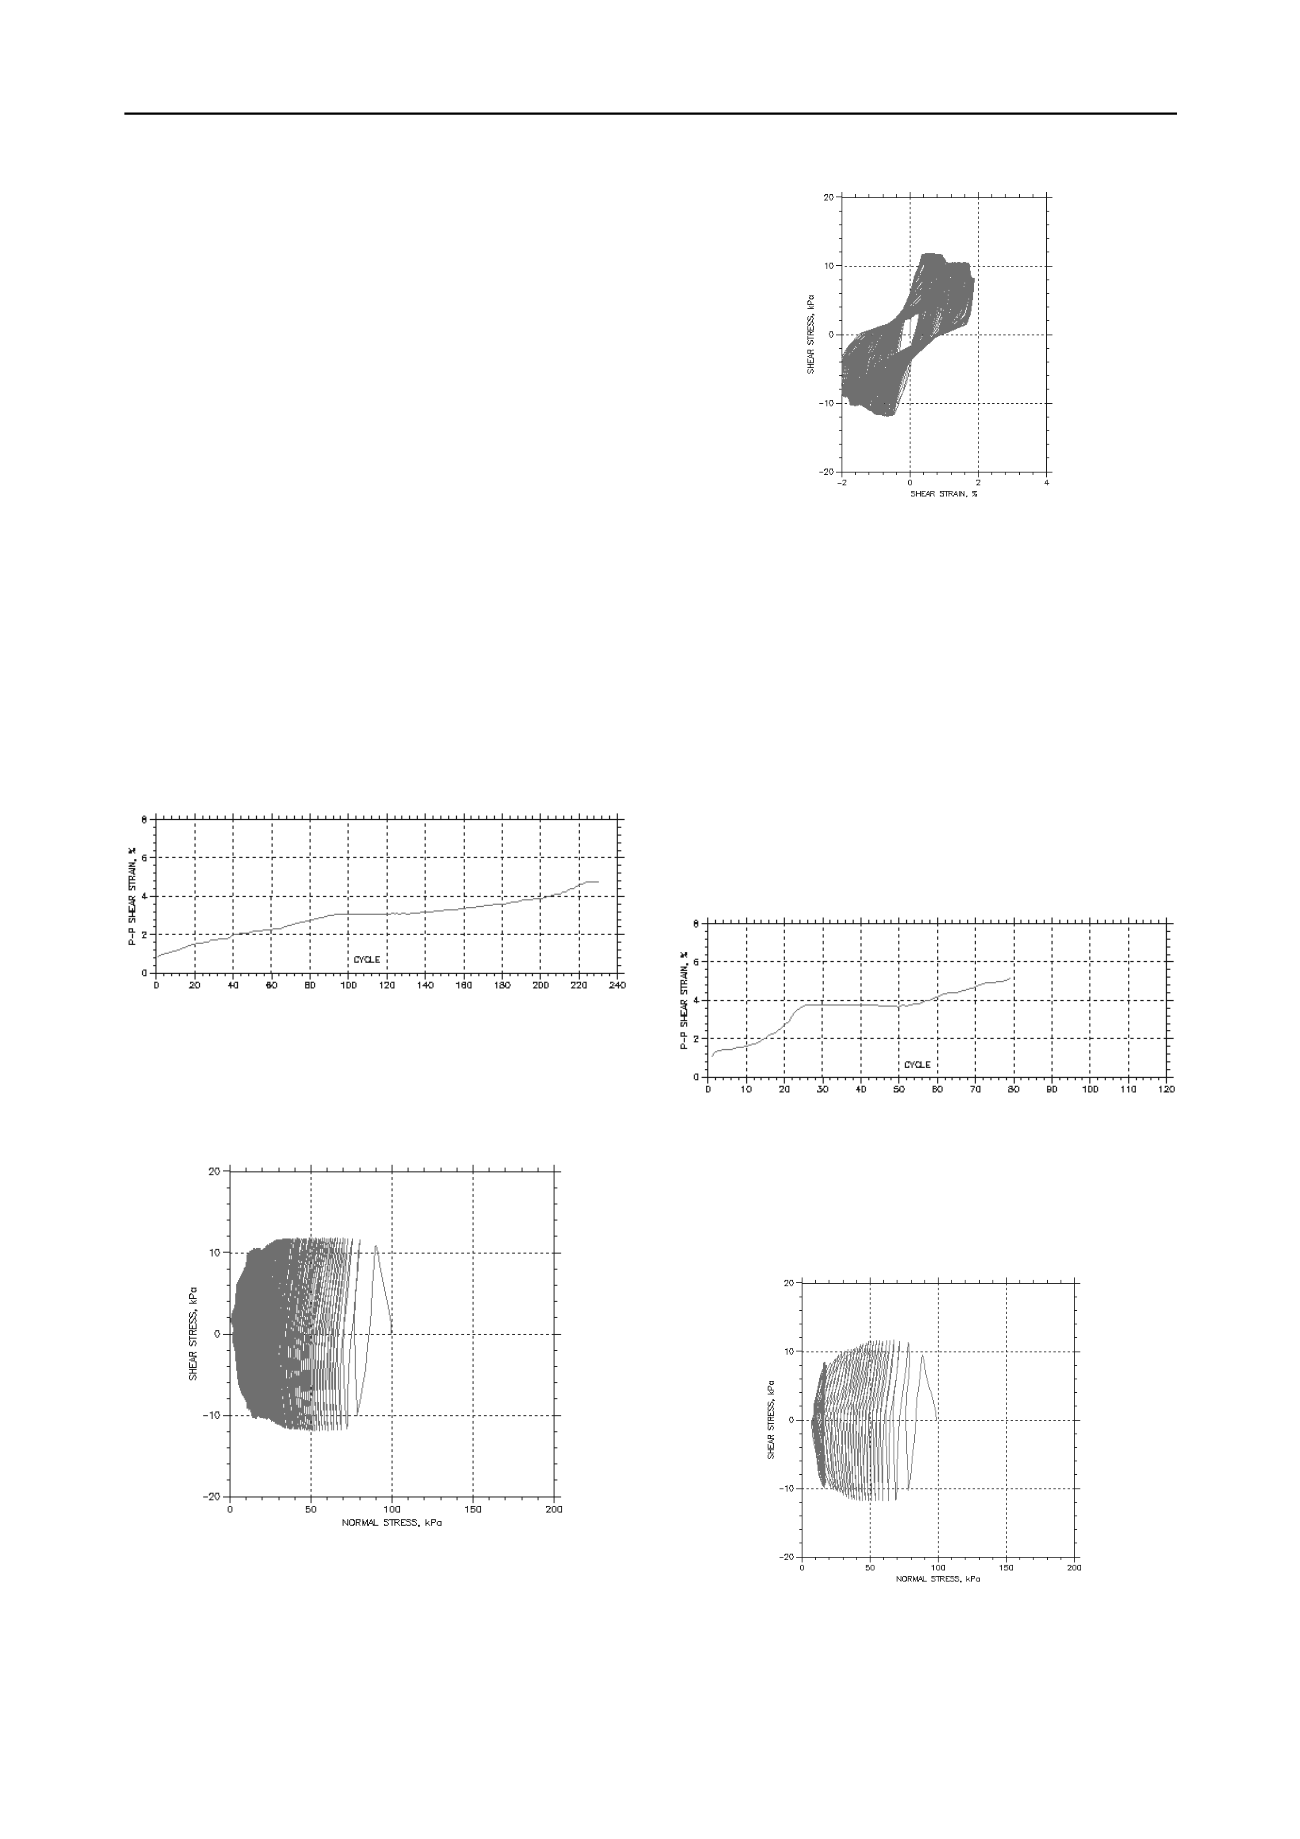
shear strain. The results of a test are shown in Figure 6, 7 and
8.Figure 8 shows the applied cyclic shear stress of +/- 12 kPa
(CSR = 0.12). Figure 6 shows the development of shear strain
throughout the test, which reaches 4% double amplitude shear
strain at nearly 205 cycles.
8 CDSS tests were conducted, 4 tests at voids ratio of 0.898
(Dr 65%) and CSR range of 0.10, 0.12, 0.14, and 0.16. 4 tests at
voids ratio of 0.847 (Dr 70% and CSR range of 0.10, 0.12, 0.14,
and 0.20. All the tests were conducted at nominal initial
effective confining stress of 100 kPa to provide a basis for
comparison between tests. In case of 70% relative density,
Figure 6 shows the degradation curve and development of shear
strain with increasing number of cycles. In a general sense,
marine silty sand specimens seem to exhibit gradual increase in
shear strain and degradation of shear stiffness with increasing
number of load cycles. Typical stress paths and stress-strain
curves of tests conducted on marine silty sand specimens are
presented in Figures 7 and 8 respectively.
Figure 6 Peak-Peak Shear Strain vs No. of Loading cycles for (σ’
v
= 100
kPa, CSR=0.12 and Dr (%) = 70).
Figure 6 shows that samples having relative density of 70%
reached 2% cyclic double amplitide cyclic shear strain after 42
cycles and 205 to reach failure.
Figure 7 Stress Path During constant volume cyclic DSS loading of silty
sand for (σ’
v
= 100 kPa, CSR=0.12 and Dr (%) = 70).
Figure 8 Stress-strain response of marine silty sand under constant
volume cyclic DSS loading (σ’
v
= 100 kPa; Dr (%) = 70, CSR = 0.12;
α= 0.0; OCR = 1.0).
In case of 65% relative density, Figure 9 shows the
degradation curve and development of shear strain with
increasing number of cycles. Typical stress paths and stress-
strain curves of tests conducted with 65% relative density on
marine silty sand specimens are presented in Figures 10 and 11
respectively.
It was observed that specimens having higher relative
densities require higher no. of loading cycles to reach 4%
double amplitude cyclic shear strain and specimens having
lower relative density reach to failure in smaller no. of loading
cycles. In case of higher cyclic stress ratio (CSR) the soil
samples reached the failure criterion in few no. of loading
cycles.
Figure 9 Peak-Peak Shear Strain vs No. of Loading cycles for (σ’
v
= 100
kPa; Dr (%) = 65, CSR = 0.12; α= 0.0; OCR = 1.0).
Figure 9 shows that samples having relative density of 65%
reached 2% cyclic double amplitide cyclic shear strain after 15
cycles and 57cycles to reach failure.
Figure 10 Stress Path During constant volume cyclic DSS loading of
silty sand for (σ’
v
= 100 kPa; Dr (%) = 65, CSR = 0.12; α= 0.0; OCR =
1.0).


