2409
Technical Committee 209 /
Comité technique 209
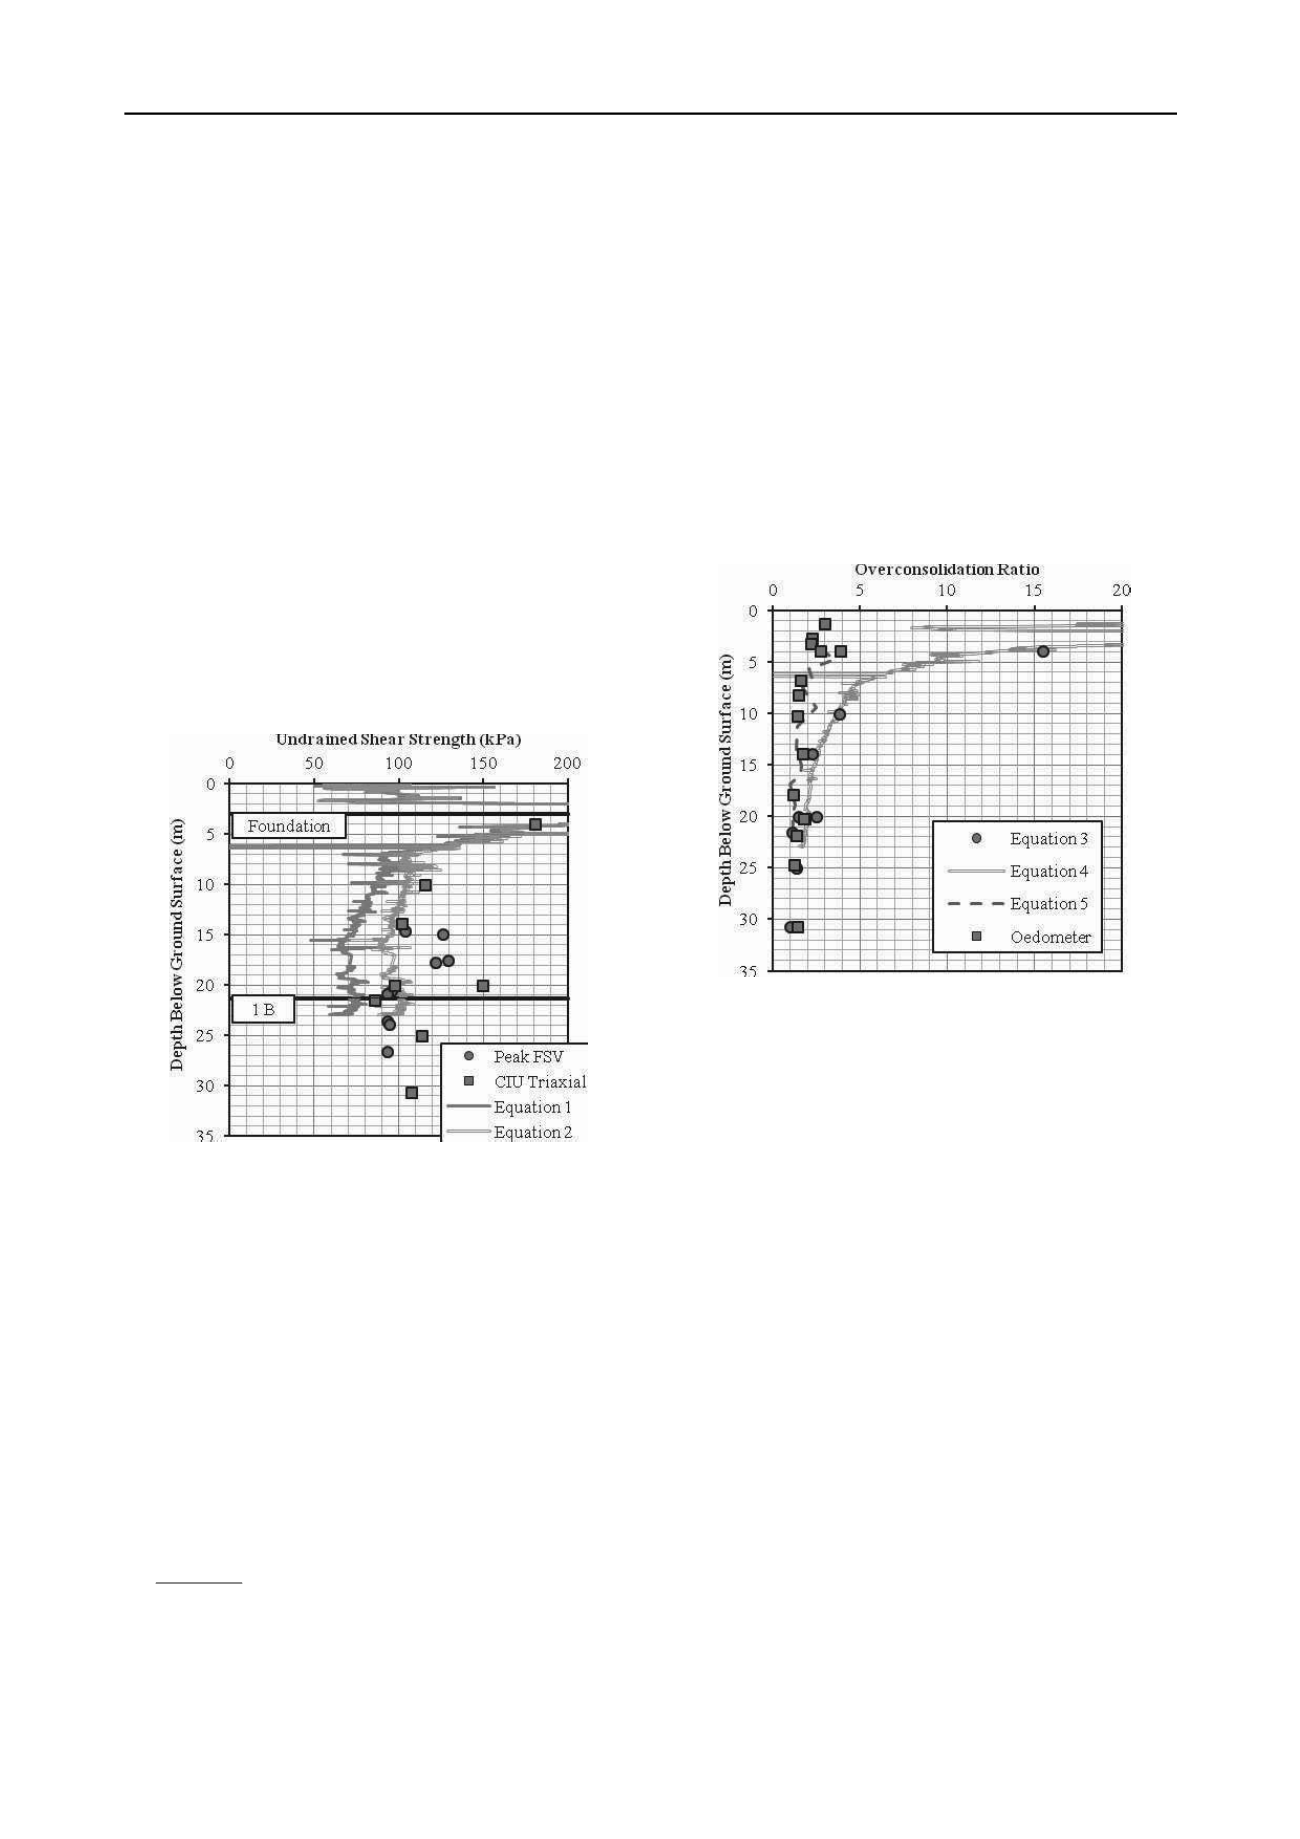
shown in Figure 2. All of the profiles show that the values of s
u
are relatively constant with depth below 7 m and are in the
range of 100-130 kPa. The lower crust material (2-4.5 m)
increases in strength rapidly, in excess of 250 kPa and the upper
crust material has a similar strength to the lower till. The usual
hierarchy of strengths is seen for the different methods, due to
the different modes of shearing. However, the field vane (FSV)
shows higher values than the triaxial compression (CIU) test.
This is likely due to partial drainage and problems rotating the
vane slowly enough for an undrained state. Two estimates have
also been determined from the CPT (Mayne, 2007):
s
u
= (q
t
-
vo
)/N
kt
(1)
s
u
=
u/B
q
.N
kt
(2)
where N
kt
is a cone factor (taken as 15),
u is the excess pore
pressure and B
q
is the ratio of excess pore pressure to the net
cone resistance (q
t
-
vo
). The approach based on excess pore
pressures appears to give better estimates for the strengths, but
the cone would be anticipated to provide lower values than CIU
triaxial, since the shearing mode is a complex combination of
triaxial compression/extension and plane strain. The depth of
the foundation base and one base diameter (B) are also shown.
Figure 2. Undrained shear strength with depth.
From oedometer testing, average compression index (c
c
) for the
three layers was found to be 0.072 and average recompression
index (c
r
) was 0.008, giving a ratio of 0.12, which is in the usual
range in the literature. The values of the two indices are quite
low and are typical for sandy clays/silts, and the values from the
crustal material are lower than those for the weathered till.
The pre-consolidation pressures (
vp
’
) from oedometer tests
have been estimated using the method of Boone (2011) and the
corresponding overconsolidation ratio (OCR) is shown in
Figure 3. This shows low OCRs in the weathered till, with a
relatively small increase in the crustal material, up to an OCR of
4. Another estimate of OCR is shown using the relationship of
Ladd et al. (1977), equation (3), with m = 0.8 and the ratio of
undrained shear strength (from CIU triaxial testing) to the
in
situ
vertical effective stress [s
u
/
vo
’
]
nc
= 0.22:
m
nc vo
u
oc vo
u
OCR
/ s
/ s
(3)
This shows similar values of OCR at depths below 15 m, but
much higher OCR values for shallower depths, up to an OCR of
15 at 4 m. Two further estimates of over-consolidation ratio
have been made using the CPT data with expressions for the
preconsolidation pressure (
vp
’
), after Mayne (2007):
vp
’
= 0.33.(q
t
-
vo
)
(4)
vp
’
= 0.161.G
o
0.478
.
’
vo
0.42
(5)
where G
o
is the small-strain stiffness determined from the
seismic cone data,
takes a value of 0.85 for silts and q
t
is the
cone tip pressure. These relationships show similar
characteristics to the previous estimates, with the small-strain
expression closely following the oedometer derived data and the
CIU triaxial derived data following the CPT expression.
Interestingly, the ratio of undrained shear strength to the
in situ
vertical effective stress in the upper crust [s
u
/
vo
’
]
oc
shows quite
high values of 2.7-3.4, dropping to 0.3 at depth. This suggests
values of K
o
in excess of 1 and as high as 2.4 in the crust.
Figure 3. Overconsolidation ratio with depth.
2.5
Small-strain stiffness properties
Small-strain stiffness (G
o
) is presumed to be a function of the
void ratio, stress history and ratio of horizontal (h) to vertical
stresses (v). It is also thought to be related to the soil macro-
fabric and can often display cross-anisotropic characteristics
(where the vertical axis is an axis of radial symmetry). The
characterization of cross-anisotropic elastic materials can be
reduced to five independent elastic moduli (E
h
, E
v
,
vh
,
hh
and
G
hh
; Pennington et al., 1997).
In situ
and laboratory estimates of
small-strain stiffness often use measurements of shear wave
velocity (V
s
) travelling and polarized in different directions to
determine shear modulus. Hence various methods of
determining
in situ
elastic moduli provide often provide
different components of the elastic stiffness tensor G
o(ij)
.
Estimates of the small-strain stiffness (G
o
) from different
in
situ
tests are shown in Figure 4. This includes cross-hole
geophysics, seismic cone and two correlations; one using
standard CPT output parameters (Long and Donohue, 2010) and
one based on soil properties (Hardin and Black, 1969):
V
s
= 1.961.q
t
0.579
.(1+B
q
)
1.202
(6)
V
s
= (159-53.5e
o
).OCR
0.18/2
.
’
vo
0.25
(7)
where V
s
is the shear wave velocity, e
o
the
in situ
void ratio,
small-strain shear modulus G
o
=
.V
s
2
and
is density. The
values of G
o
appear to generally increase with depth and range
from 50 to 350 MPa, with the majority of values being between
75 and 150 MPa. The cross-hole measurements were made with
an axial hammer system and thus provide estimates of G
ohv
;
these values are generally constant with depth and give the


