2388
Proceedings of the 18
th
International Conference on Soil Mechanics and Geotechnical Engineering, Paris 2013
2 SCOPE OF STUDY
Seven full-scale 457mm diameter, 13.5mm wall thickness
(increased to 20mm over top 2.5m), open-ended steel pipe-piles,
six (R1 – R6) with embedded lengths around 19m and one (C1)
driven to 10m were installed as part of the Grouted Offshore
Piles for Alternating Loading (GOPAL) project (Parker et al.
1999) in a flat area close to Dunkerque Port Ouest Industrial
Zone. The site has a relatively deep profile of dense sand,
Figure 2. Chow (1997) reported static and cyclic pile tests
incorporating pore pressure measurements that showed a fully
drained response over the loading rates applied. The piles’
cyclic capacity trends have been reported by Jardine and
Standing (2000, 2012), while Jardine et al. (2006) reported the
static tension capacity–time trends.
3 TEST PROGRAMME
Jardine et al. (2006) detail the testing arrangements, pile head
load control and displacement measurements. The cyclic test
programme is detailed on Table 1; load cycles were performed
with periods between 1 to 2 minutes depending on the pile
response. The axial cyclic load was applied in approximately
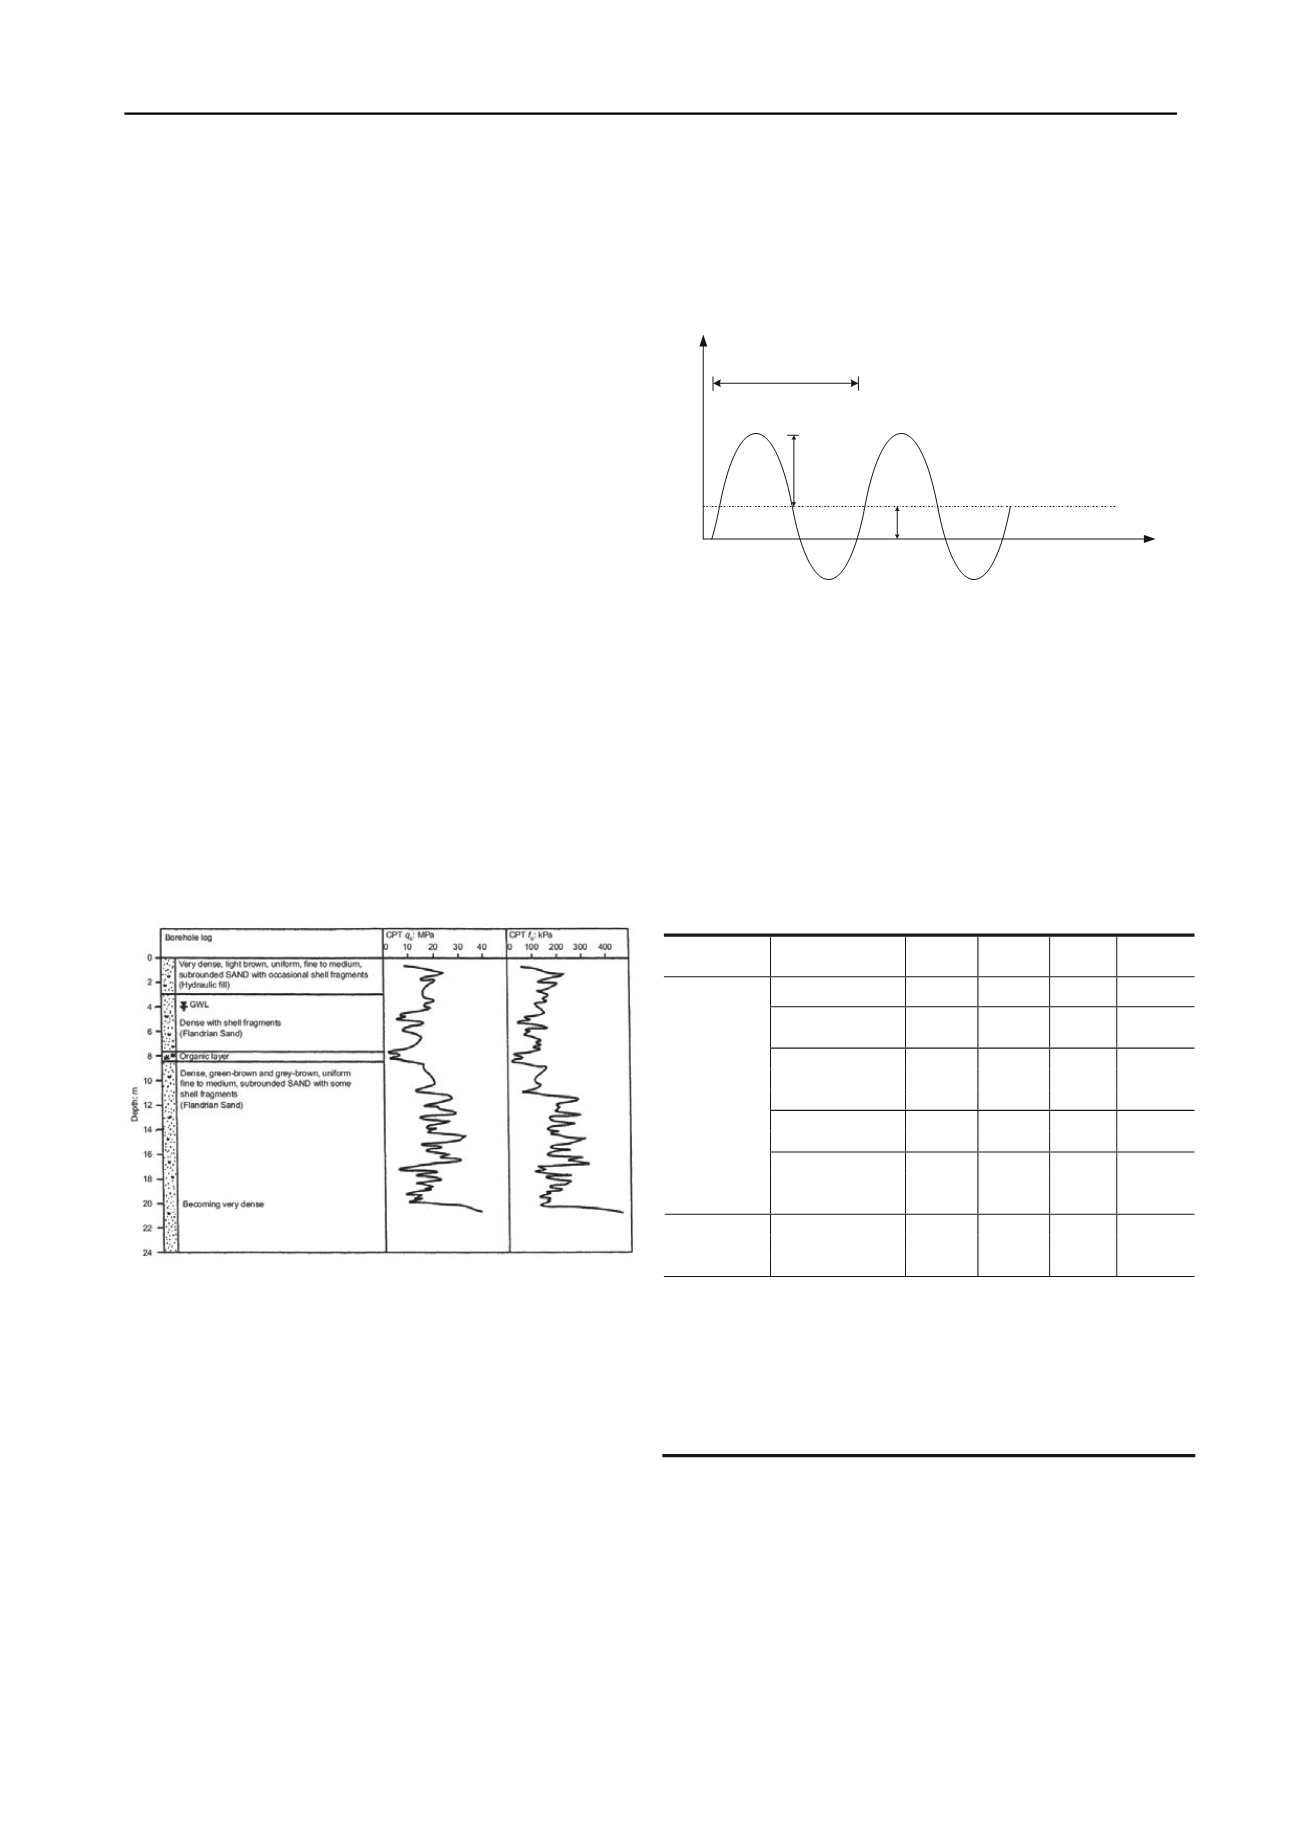
sine wave forms as defined in Figure 3. The load-controlled
tests involving only tensile pile head loads are termed ‘one–
way’ while cycles ranging from tension to compression are
referred to as ‘two–way’; tension loads and upward
displacement responses are taken as positive throughout.
Reference static tension tests to failure were conducted after
most of the cyclic tests to assess the effects on the applied axial
cyclic loading on the operational static tension (shaft) capacity
and isolate any effects of previous (static or cyclic) loading
phases from the current axial cyclic behaviour.
Figure 2. Typical site profile for Imperial College test site (Chow 1997)
4 RESULTS AND INTERPRETATION
4.1 Cyclic failure criteria
The axial cycling displacement response is classified as stable
(S), meta–stable (MS) or unstable (US) according to the
following criteria.
Stable
response signifies low and stabilising
cyclic displacements that remain below 0.01 the pile diameter,
D, and show slow rates of change ≤ 1mm/1000 cycles (N) up to
N ≥ 1000 without causing loss in operational static shaft
capacity. Tests with
meta–stable
responses accumulate > 0.01D
displacements but < 0.1D with moderate rates (1mm/1000
cycles < rates ≤ 1mm/10 cycles) potentially leading to some
degradation of the operational static shaft capacity but not
causing failure within 100 cycles.
Unstable
responses lead to
cyclic failure within 100 cycles, involving either accumulated
permanent cyclic displacements > 0.1D or rates of accumulation
of permanent cyclic displacements that exceed 1mm/10cycles
with potentially very significant shaft degradation.
The fourteen cyclic tests gave a range of outcomes with one
stable (set 1), four meta–stable (set 2) and nine unstable (set 3)
responses indicated in Figure 1. The following sections analyse
the cyclic stiffnesses and accumulated displacements seen in
these three modes using the terms defined in Figure 4.
Figure 3. Load–controlled axial cycling illustrated (Tsuha et al. 2012)
4.2 Pile axial cyclic stiffness
The variations of the piles’ secant stiffness, k = ΔQ/Δs, under
first-time static tension loading are shown on Figure 5
represented by the stiffnesses ratio, k/k
Ref
, against the load ratio,
Q/Q
Ref
, where k
Ref
is the pile stiffness at the first monotonic
load step, Q
Ref
, in the first-time tension tests. The 19m long
piles (R2 to R6) follow common trends although one ‘younger’
and lower ultimate capacity 19m long pile R1 degraded more
rapidly than the others as did the shorter (10m long) pile C1.
Table 1. Axial cyclic loading test programme: after Jardine & Standing
2000)
(
Test mode
Test code
Q
cyclic
(kN)
Q
mean
(kN)
Q
T
(kN)
N
f
US 3.R2.CY2
1000
1000
2500
9
MS 2.R3.CY2
700
700
2315
200+
US 2.R3.CY3
950
950
2050
13
MS 2.R4.CY2
1000
1000
2960
221+
US 2.R4.CY4
750
1250
2000
3
S 3.R4.CY6
400
405
2110
1000+
MS 2.R5.CY2
750
1250
2465
345
US 2.R5.CY3
700
700
2000
27
US 2.R6.CY2
750
1250
2000
1
US 2.R6.CY4
700
700
1585
24
One–way
MS 3.R6.CY6
700
700
1650
206
US 2.C1.CY3
620
-40
840
41
US 2.C1.CY4
445
165
620
1
Two–way
US 2.C1.CY5
410
10
620
12
Test code explanation:
XX M.YY.ZZN:
XX = Pile response mode (S - Stable, MS – Meta-stable, US –
Unstable)
M = Testing campaign phase (out of 3)
YY = Pile name (C1, R2 – R6)
ZZ = Test type (T – Static tension, C - Static compression, CY – Axial
cyclic)
N = Test number on the pile in sequence from installation
Figure 6 examines the axial cyclic stiffness trends for the
stable and meta–stable (sets 1 & 2 on Figure 1). The initial
normalised stiffness values (i.e. k
l
/k
Ref
at N = 1) generally
decreases as the proportion of applied Q
max
to Q
T
increases. In
the stable loading test 3.R4.CY6, it can be seen that continued
cycling leads to only a marginal stiffness decrease (12%) over
1000 cycles, with stiffness values stabilising and then
marginally increasing after 200 cycles. Compared with this, the
four meta–stable loading tests showed similarly mild stiffness
degradation before manifesting sharply accelerating stiffness
degradation as the piles approached cyclic failure under the
conditions given in Table 1.


