2231
Technical Committee 208 /
Comité technique 208
are expressed. It is summarized that the high performance
elasto-plastic constitutive model can be introduced into the SPH
method. Also, it is possible to simulate the various state of
geomaterial, such as the clay and sand, using the SPH method.
Table 1. Material parameters
(a)Drucker-Prager model
Case
1
Young's modulus
E
[kPa] 1000.0
Poisson's ratio
0.33
cohesion
c
[kPa] 50.0
internal friction angle
[deg] 30.0
initial mean stress
p
0
[kPa] 98.0
(b) Super-subloading Yield Surface Modified Cam-clay model
Case
2
3
4
5
6
7
<
elasto-plastic parameters
>
compression index
0.200
0.052
swelling index
0.050
0.010
critical state constant
M 1.40
1.0
NCL intercept
N
2.20
1.98
Poisson's ratio
0.3
<
evolution parameters
>
degradation index of overconsolidation
m
3.0
0.06
degradation index of structure
a
0.5
2.2
degradation index of structure
b=c
1.0
<
initial value
>
initial degree of overconsolidation
1/
R
0
5.01 1.16
20.0
initial degree of structure
1/
R
0
*
5.0
1.40 10.0 23.6 39.0
initial specific volume
v
0
2.20
1.95
initial mean stress
p
0
[kPa] 98.1 294.3 20.0 98.1 196.2 294.3
0
50
100
150
0 5 10 15 20 25 30 35 40
Case1(theory)
Case2(SPH)
Shear stress
xy
[kPa]
Shear strain
xy
[%]
0
50
100
150
200
250
300
0 100 200 300 400 500 600
I
1
[kPa]
(
J
2
)
1/2
[kPa]
(a)stress-strain relation (b)stress paths
Figure 3. Drucker-Prager model (Case 1)
0
50
100
150
200
250
300
0
5
10
15
20
Case2(theory)
Case3(theory)
Case2(SPH)
Case3(SPH)
Deviator stress
q
[kPa]
Shear strain
xy
[%]
0
50
100
150
200
250
300
0 50 100 150 200 250 300
Deviator stress
q
[kPa]
Mean stress
p
[kPa]
(a)stress-strain relation (b)stress paths
Figure 4. Super-subloading Yield Surface Modified Cam-clay model
(Cases 2 and 3)
0
50
100
150
200
250
300
0
5
10
15
20
Case4(theory)
Case5(theory)
Case6(theory)
Case7(theory)
Case4(SPH)
Case5(SPH)
Case6(SPH)
Case7(SPH)
Deviator stress
q
[kPa]
Shear strain
xy
[%]
0
50
100
150
200
250
300
0 50 100 150 200 250 300
Deviator stress
q
[kPa]
Mean stress
p
[kPa]
(a)stress-strain relation (b)stress paths
Figure 5. Super-subloading Yield Surface Modified Cam-clay model
(Cases 4 to 7)
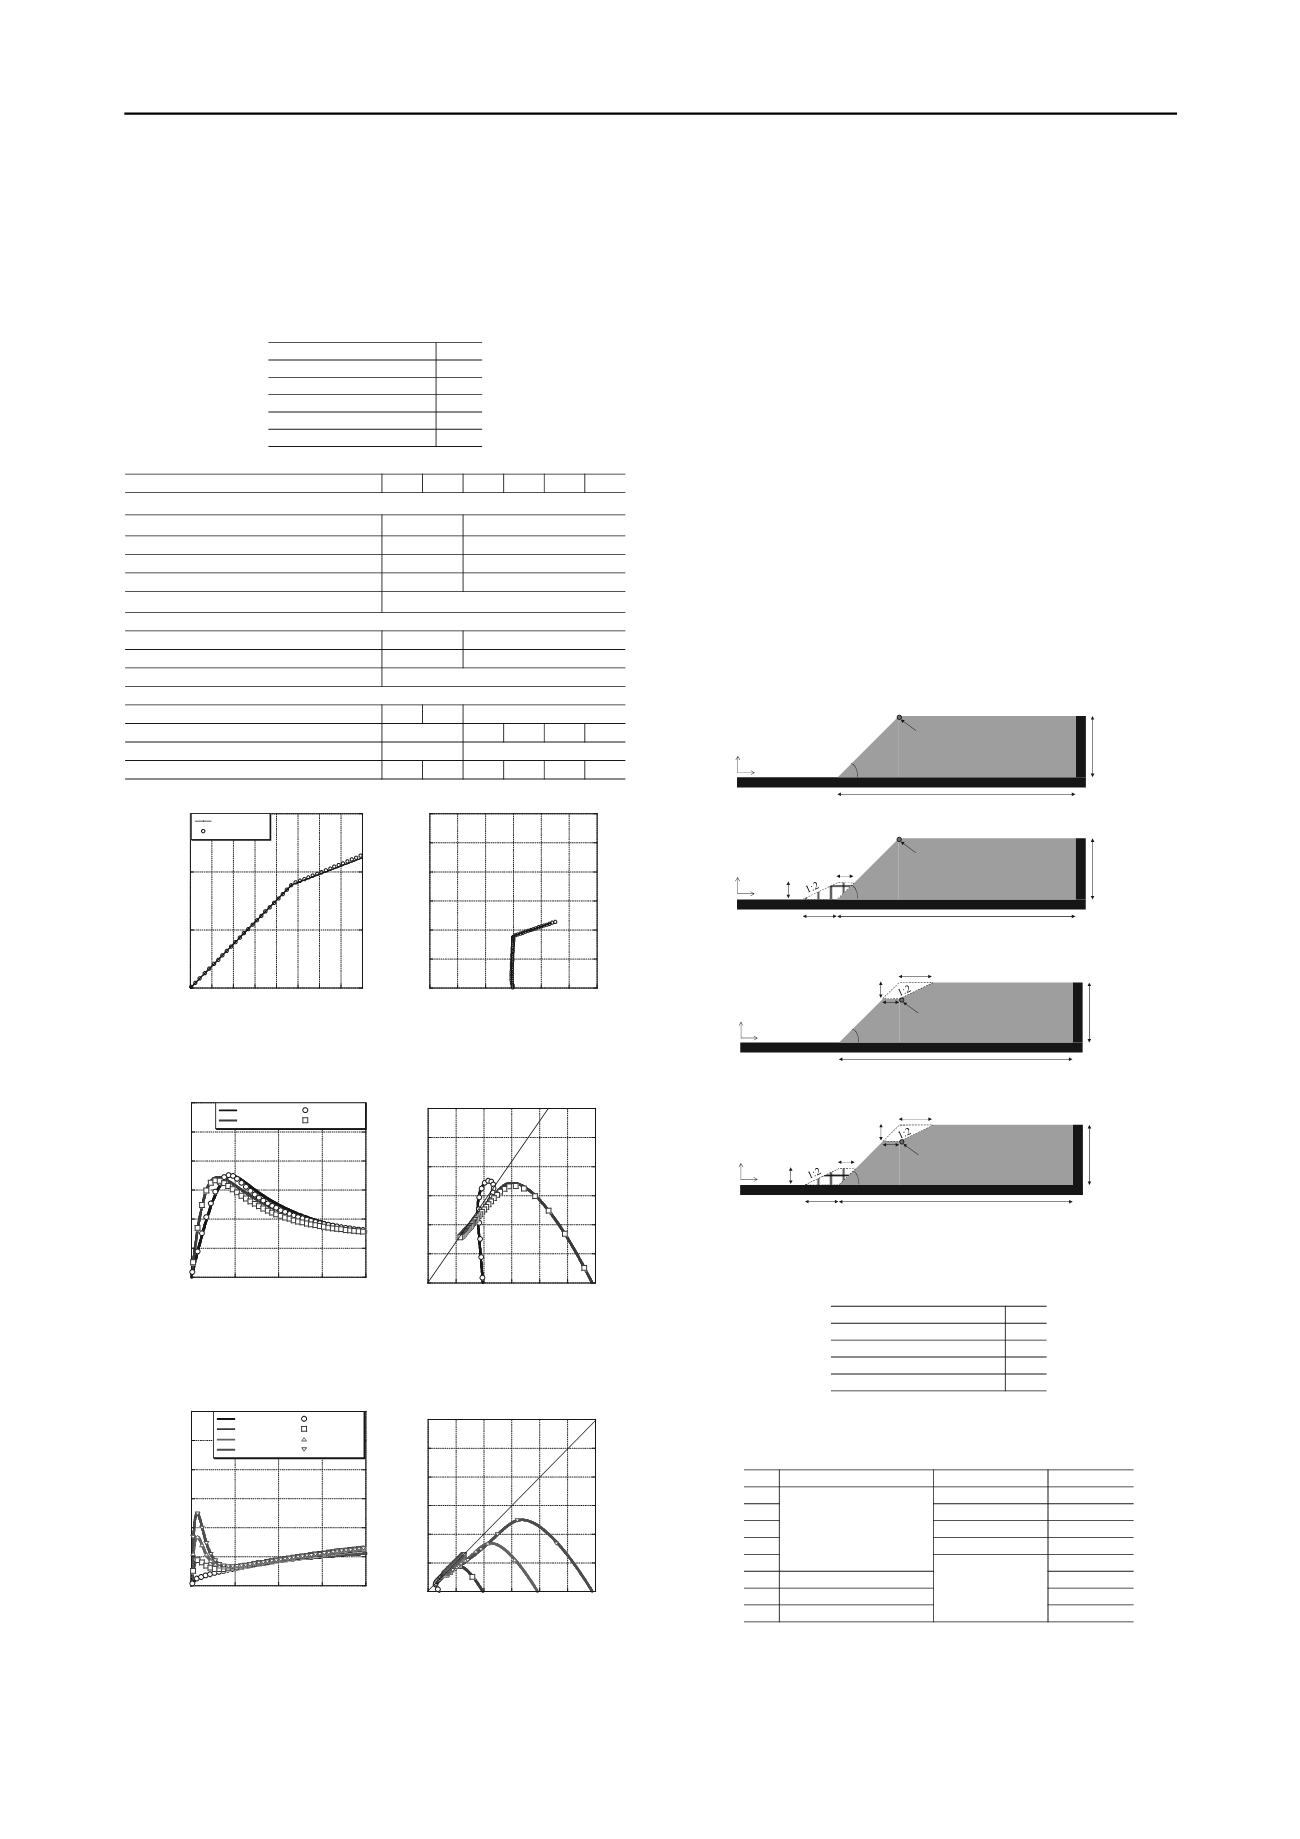
4 SLOPE STABILITY ANALYSIS CONSIDERING
COUNTERMEASURES
A slope stability analysis considering countermeasures is
carried out, using the Drucker-Prager model. Two types of
countermeasures, such as top soil removal work and
counterweight fill, are considered into these simulations. The
numerical results are compared with results obtained using the
safety factors calculated by the Fellenius method. Figure 6
illustrates the numerical models in Cases 1 to 8. The slope angle
is 45 degrees and the model ground is cohesive. Also, as the
figure shows, the displacements at the top of the slope are
checked. The parameters used in this simulation are listed in
Table 2. For the boundary conditions, the horizontal direction at
the side wall of the slope was fixed, and the vertical direction is
free. The horizontal and vertical directions at the bottom of the
embankment are fixed. Fixed boundary particles are used to
describe the walls. In order to take into account the effect of
surface compaction, the internal friction angle of the
counterweight fill material is set to 30 degrees. The effect of
pore water pressure is not taken into account. The isotropic
stress corresponding to static earth pressure is used as the initial
stress.
45deg
12~18m
70m
Measurement point
for displacement
x
y
(a) Slope without any countermeasures (Cases 1 to 5)
18m
70m
45deg
10m
5m
5m
Measurement point
for displacement
x
y
(b) Slope with soil removal work (Case 6)
18m
70m
45deg
5m
5m
10m
Measurement point
for displacement
x
y
(c) Slope with counterweight fill (Case 7)
18m
70m
10m
5m
5m
45deg
5m
5m
10m
Measurement point
for displacement
x
y
(d) Slope with both countermeasures (Case 8)
Figure 6. Numerical models.
Table 2. Material parameters.
Young's modulus
E
[MPa] 100.0
Poisson's ratio
0.30
cohesion
[deg]
0.0
internal friction angle
c
[kPa]
50
unit weight
[kN/m
3
] 19.6
Table 3. Safety factors obtained from the Fellenius method for each
ase.
c
Case
Countermeasures
Height of slope
H
[m] safety factor Fs
1
Without any countermeasures
12
1.24
2
14
3
15
4
16
5
18
0.75
6
Soil removal work
0.87
7
Counterweight fill
0.90
8
Both countermeasures
1.02
1.01
0.91
0.86
The safety factors obtained from the Fellenius method are
listed in Table 3. As Table 3 indicates, the safety factors rise
according to the order of case without any countermeasures,


