2235
Technical Committee 208 /
Comité technique 208
histories can be produced artificially or taken from records. In
every case the accelerograms must be compatible with the
acceleration spectra required by the codes.
For seismological and geotechnical applications real
accelerograms are preferred because they are more realistic for
frequency content, number of cycles, correct correlation
between the vertical and horizontal components of ground
motion and for the energy content in relation to the seismogenic
parameters. In our case the site is near the zone of a seismic
source that can generate earthquakes so we need to consider
also near fault influence. However, in order to use a real
accelerogram in near-fault conditions it is required for the time
histories to include directivity effects and fling step, in other
words they should refer to
real, near-field earthquakes. So just
for comparing the results we have also generated an artificial
accelerogram taking account the near source effects.
Considering that we have been interested for the design of
slope retaining structures the chosen accelerogram according to
EC8 spectra is multiply by 2*1.4/1.146≈ 2.45 for being
compatible with PGA taken from PSH analysis for T
R
≈475
years. The ground motion parameters are given below:
Figure
4
. Acceleration response spectras
Time [sec]
48
46
44
42
40
38
36
34
32
30
28
26
24
22
20
18
16
14
12
10
8
6
4
2
0
A c c ele ra tion [m /s ec 2]
1
0.8
0.6
0.4
0.2
0
-0.2
-0.4
-0.6
-0.8
-1
Figure 5. Time history of acceleration
PGA : 1.146m/sec2 in t=10.790sec
PGV : 0.082m/sec in t=16.590sec
PGD: 0.020m
in t=47.880sec
Vmax / Amax: 0.071sec. Predominant Period (Tp): 0.300sec
2.4
Results
From the analysis is seen that local instabilities occur before
global instabilities. To overcome this problem the filling
reinforcement with geogrids have been activated from the first
stage of excavation before defining the critical sliding surface.
In figure 6 are given the displacement of the road body fillings.
Figure 6. Local displacement
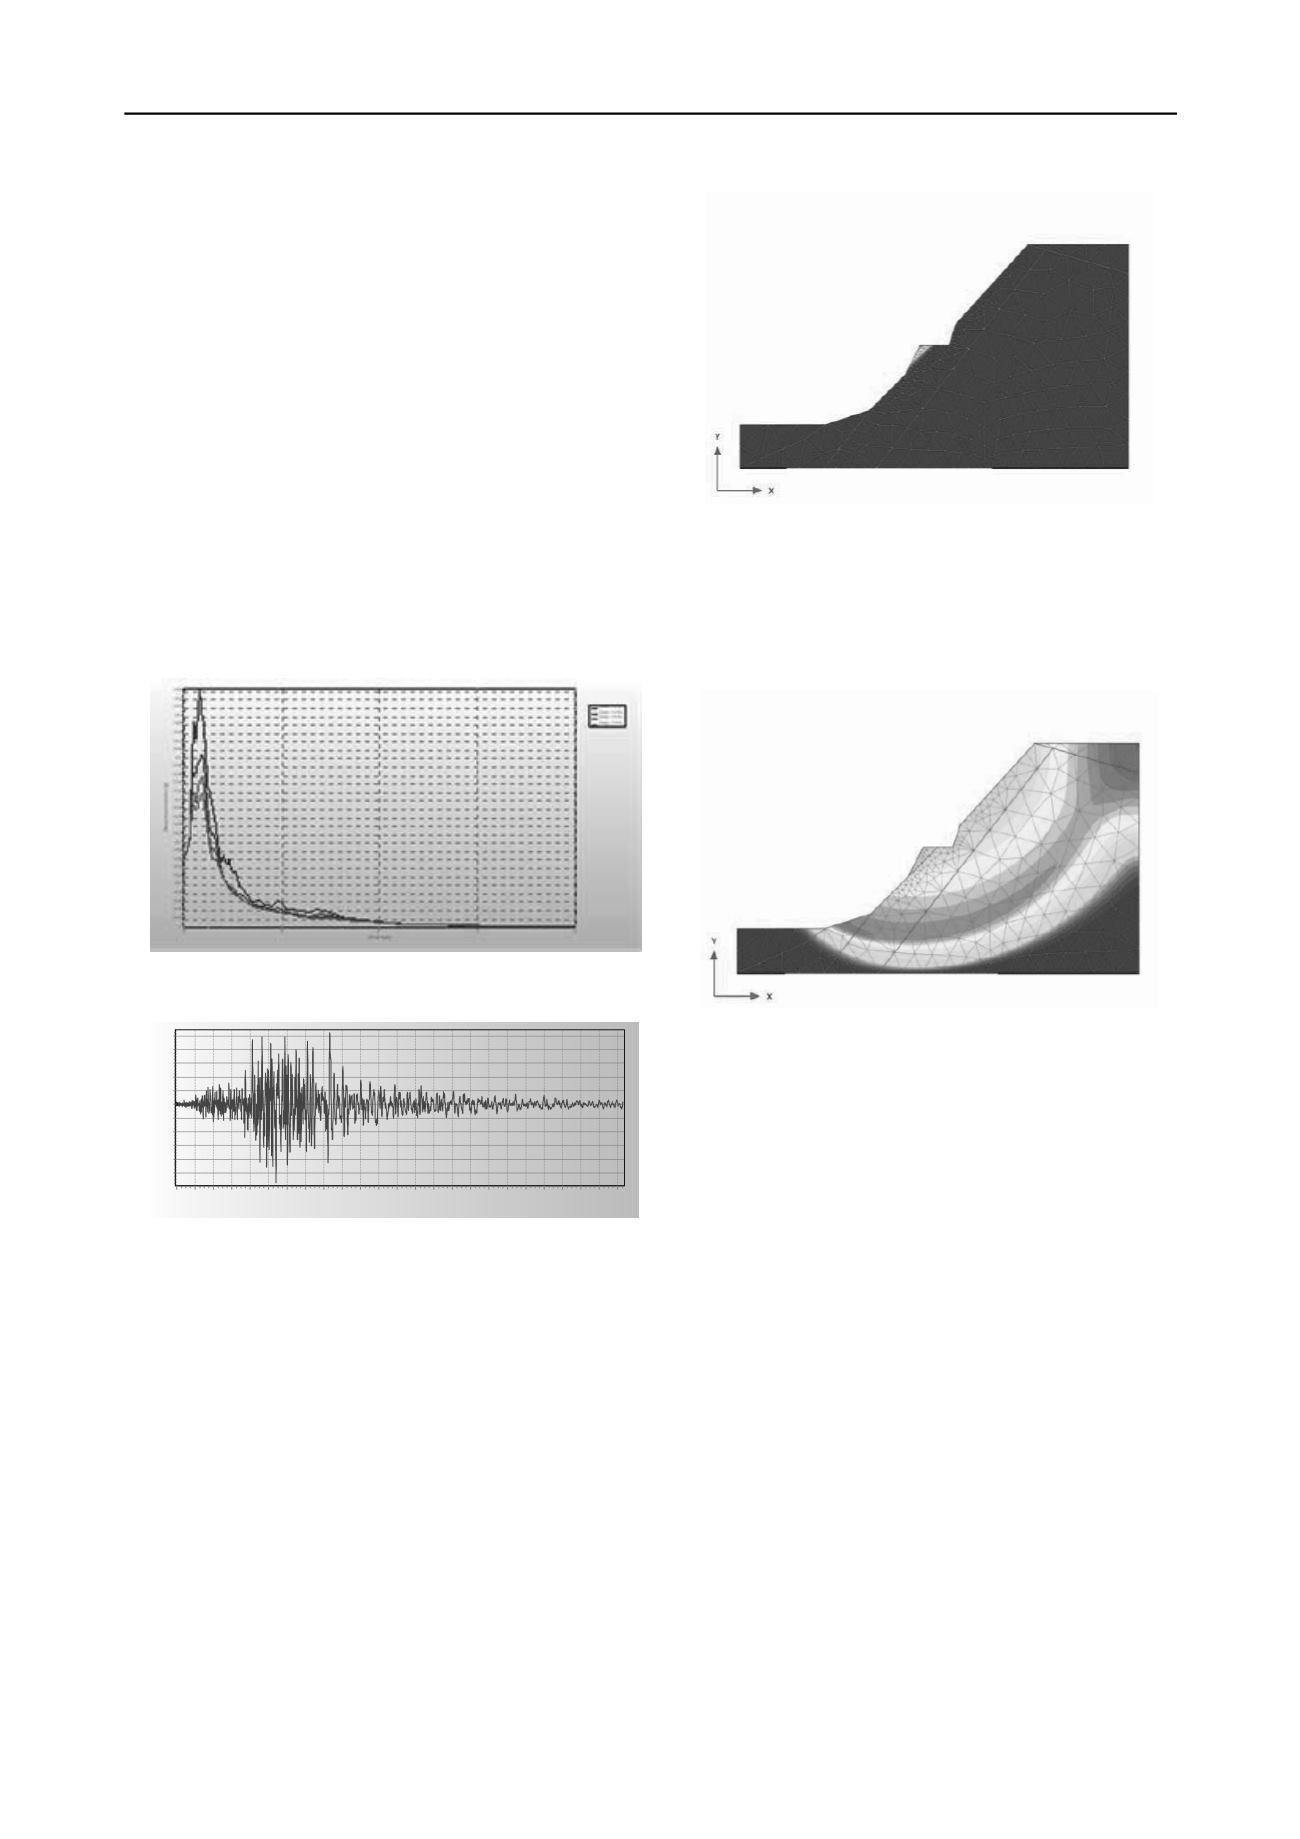
After that stage of local stabilization is done the global
stability analysis. From analysis of the displacement and
displacement incrementations we receive critical sliding surface
shape and position as shown in Figure 7.
Figure 7. Total displacement
To simulate the critical sliding surface the “interface"
element is activated with residual mechanical characteristics,
c
r
=5kPa,
F
r
= 10
o
Since in site are not observed existing deep slides that affect
the global stability of the slope conditioning the preexisting
sliding surfaces the value of cohesion is not taken zero, thus
improving also the numerical calculations The displacement
rate effect on residual strength parameters especially for seismic
loading aren’t taken in consideration.
In the case of application of a seismic load the safety
coefficient for the second model decrease and wire anchored
mesh of the slope should be strengthened, although for this case
the coefficient of security can be taken close to 1. By sensitivity
analysis of the parameters the cohesion changes are within
small limits and their small changes doesn’t affect the stability
of the slope. The friction angle changes from peak values in
those residual gives the greatest impact. These assessments we
think correspond with the real monitored cases referred in
literature. Since in the site is not implemented the wire anchored
mesh the monitoring of weathering processes of slope materials
in the future will give us the opportunity to correct resistance
parameters values taken in the first analysis and reanalyze the
slope stability.
3 CONCLUSIONS
Although the lack of data and the inability of finite element
software with elasto-plastic modeling with Mohr-Coulomb
yield criteria or softening criteria, to take into account the


