2226
Proceedings of the 18
th
International Conference on Soil Mechanics and Geotechnical Engineering, Paris 2013
initial relative density of specimens produced were 80%±3%.
To saturate the specimen, de-aired water was flushed through
the specimen and then a back pressure of 50 kN/m
2
was applied.
All specimens were isotropically consolidated for 1 hour and
then were sheared to reach maximum and minimum principal
stress ratio of about 4.0. The cyclic change in pore water
pressure was applied to the anisotropically consolidated
specimen with constant amplitude. The principal stress
difference was also kept constant by moving the top pedestal
with constant axial deformation rate of 0.1%/min. The loading
and unloading of the pore water pressure was conducted
through a constant pressure increment of 1 kPa/min. After
cyclic loading, monotonic loading of pore water pressure was
applied to understand the strength of the specimen.
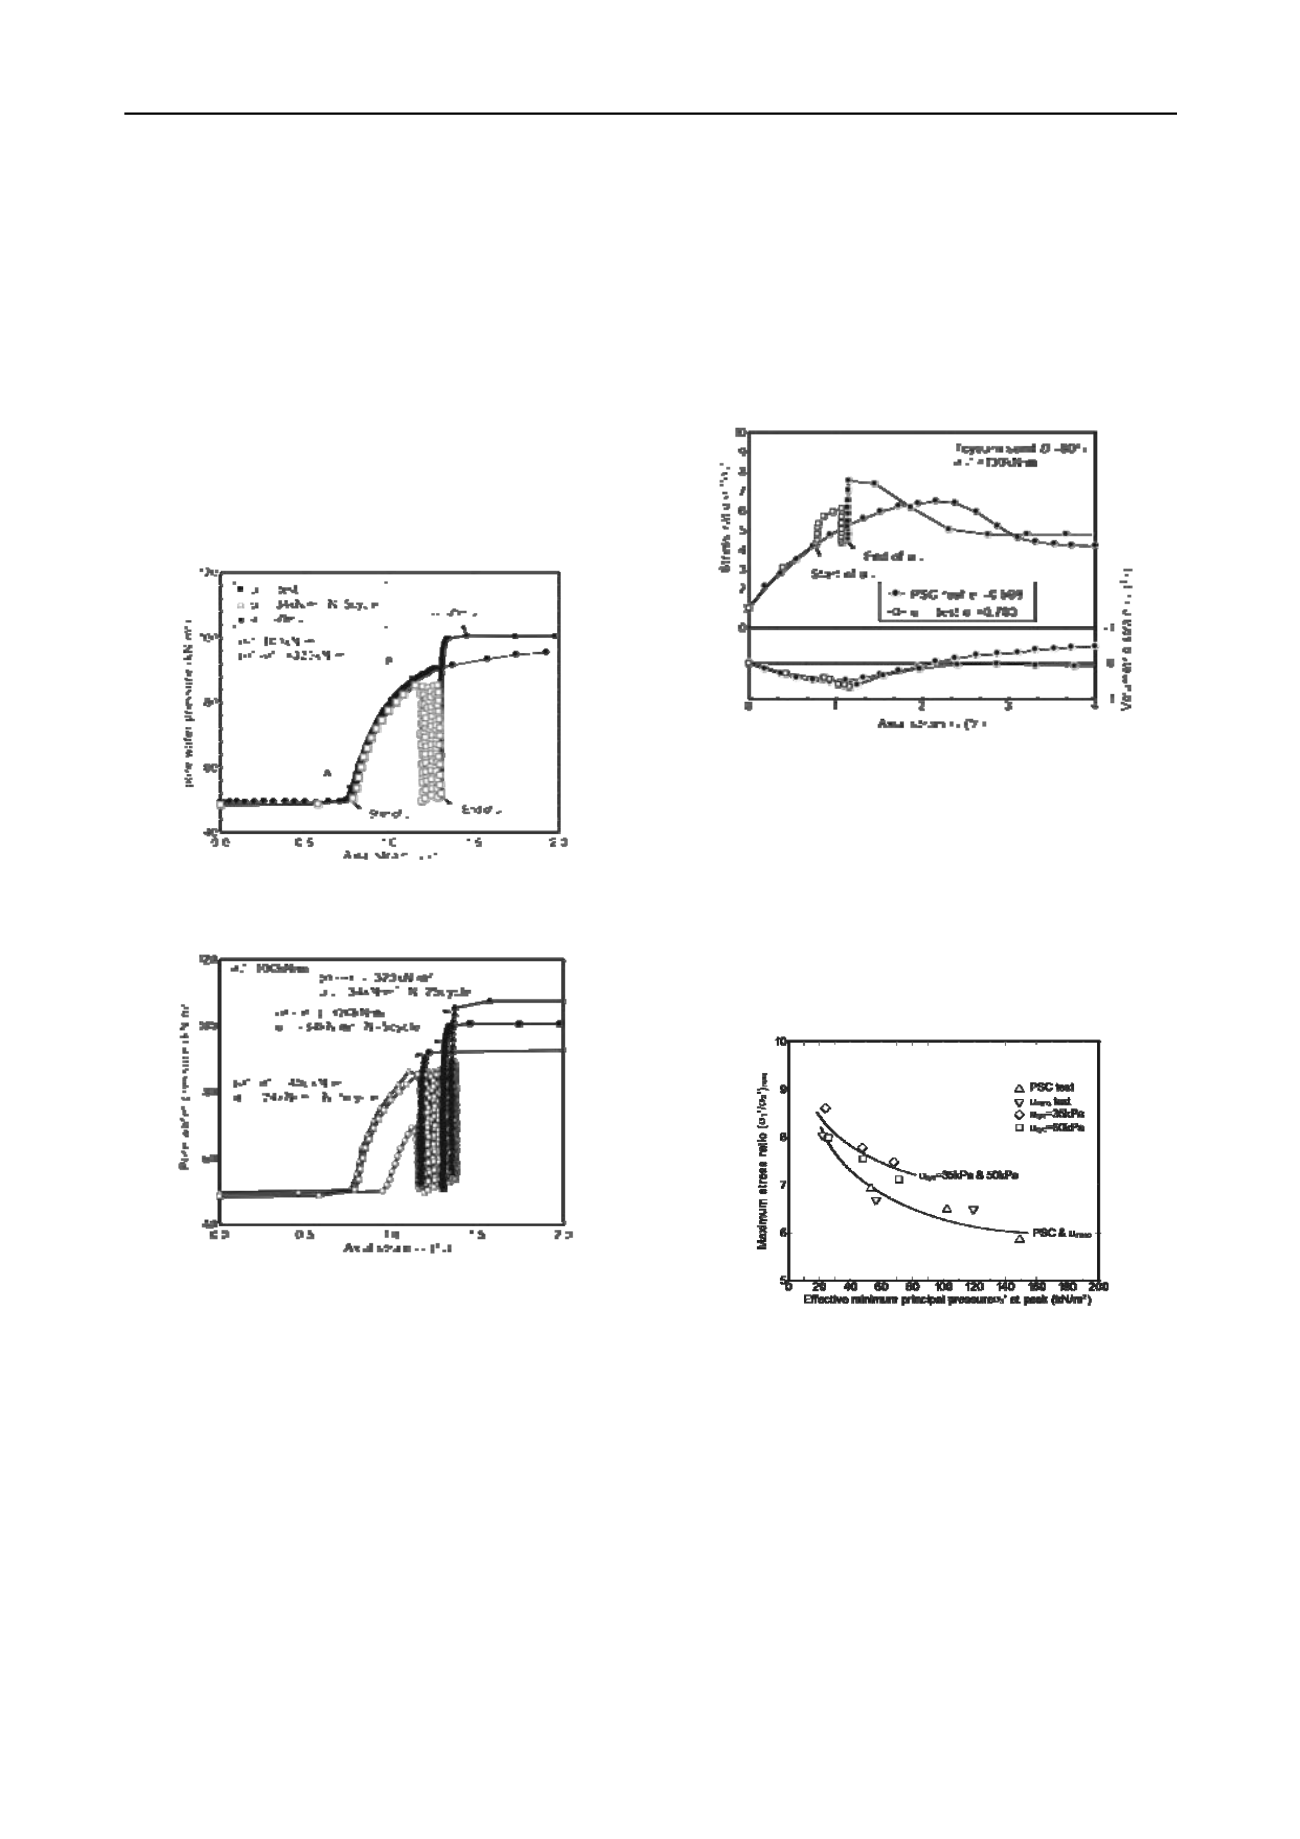
2.2 Cyclic deformation behavior due to pore water pressure
Figure 1 Deformation behavior due to cyclic and monotonic loadings of
pore water pressure
Figure 2 Effect of N and (
'
1
�
’
3
) on the deformation behavior
Figure 1 shows the pore water pressure and axial strain
relationship for the cyclic test under 100 kN/m
2
of the lateral
pressure. The principal stress difference (
’
1
-
’
3
) was kept
constant at 320 kN/m
2
. This value corresponded to the residual
stress obtained from plane strain compression (PSC) test under
100 kN/m
2
of lateral pressure. The cyclic change in pore water
pressure, u
cyc
was the amplitude of 34 kN/m
2
. The maximum
principal stress ratio reached corresponded to that of PSC test
result at 100 kN/m
2
. The sand specimen generated 0.40% of
axial distortion from 0.75% (A) to 1.15% (B) during the 1st
loading of pore water pressure. After this, the specimen showed
0.15% of axial strain during the rest of the cyclic loading. For
comparison, monotonic pore water pressure loading was applied
as shown in the figure. The specimen subjected to cyclic pore
pressure loading showed rigid-plastic behavior and reached a
higher pore water pressure level than the monotonically-loaded
specimen without any cyclic loading.
Figure 2 shows the cyclic loading test results with 100
kN/m
2
of lateral pressure. As the number of cycles increase, the
axial deformation becomes larger during the cyclic loading.
Also, as the principal stress difference (
’
1
-
’
3
) is kept higher,
the peak pore water pressure during the monotonic loading after
the u
cyc
process becomes lower. This is because the higher stress
difference (
’
1
-
’
3
) is closer to the failure stress condition.
After first loading, relatively small axial deformations were
obtained irrespective of the amount of u
cyc
and number of cycles
N. This indicates that the cyclic loading of pore water pressure
never lead to any larger deformation and failure.
2.3 Failure after cyclic change of pore water pressure
Figure 3 Stress-strain behavior from monotonic and cyclic loading of
pore water pressure
Figure 3 shows the principal stress ratio
’
1
/
’
3
and axial strain
relationship for the test results shown in Figure 1. The stress-
strain curves before u
cyc
loading are the same indicating good
reproducibility of the specimen. Then, cyclic loading was
initiated from the residual stress condition as described earlier.
The sand subjected to the loading with u
cyc
= 34 kN/m
2
reaches
a higher maximum stress ratio (
’
1
/
’
3
)
max
= 7.5 compared with
(
’
1
/
’
3
)
max
= 6.0 for the conventional PSC test. The volume
change during the cyclic loading is relatively small.
Figure 4 Stress dependency on peak stress ratio
Figure 4 shows the maximum stress ratio (
’
1
/
’
3
)
max
plotted against the minimum principal stress at the peak stress
condition. It can be seen that the value of (
’
1
/
’
3
)
max
decreases
as
3
at peak increases. As generally well known the stress
dependency on the peak stress has been observed. In addition,
the results of the cyclic loading of pore water pressure shows a
higher (
’
1
/
’
3
)
max
than PSC tests. The results of the monotonic
tests were similar with those of PSC test results. It can be
recognized that the cyclic loading may induce the hardening and
strengthening of the soil.
3 COLLAPSE BEHAVIOR OF SLOPE DUE TO GWL
The Kiyo District of Hagi City, Yamaguchi Prefecture has been
known to be an unstable landslide area. The slope has geologic
profile consisting of rhyolite and granite with a lower


