2227
Technical Committee 208 /
Comité technique 208
Proceedings of the 18
th
International Conference on Soil Mechanics and Geotechnical Engineering, Paris 2013
permeability. Previous failures have occurred at the site in 1973,
1981, 1991 and 1994. In 2000, a landslide occurred as far as the
lower debris flow barrier. In 2002 ground surface movements
were observed without any apparent flow of soil mass. In order
to monitor the stability of the slope, a monitoring system was
installed since 1988 as shown in Figures 5 and 6. The main
parameters measured were rainfall, ground water level (GWL)
and slope movements using extensometers. The data were
recorded remotely at the National Highways Bureau in Hagi.
The system was upgraded in 2004 by installing inclinometers in
the slope and debris barrier. In addition, a strain-gauged tell-tale
system was installed across a crack in the barrier. The data
logging and communications system was updated with wireless
technology. The data has been automatically updated on a
website. Moreover a mailing notification system has been
installed in case of unusual conditions developing at the site.
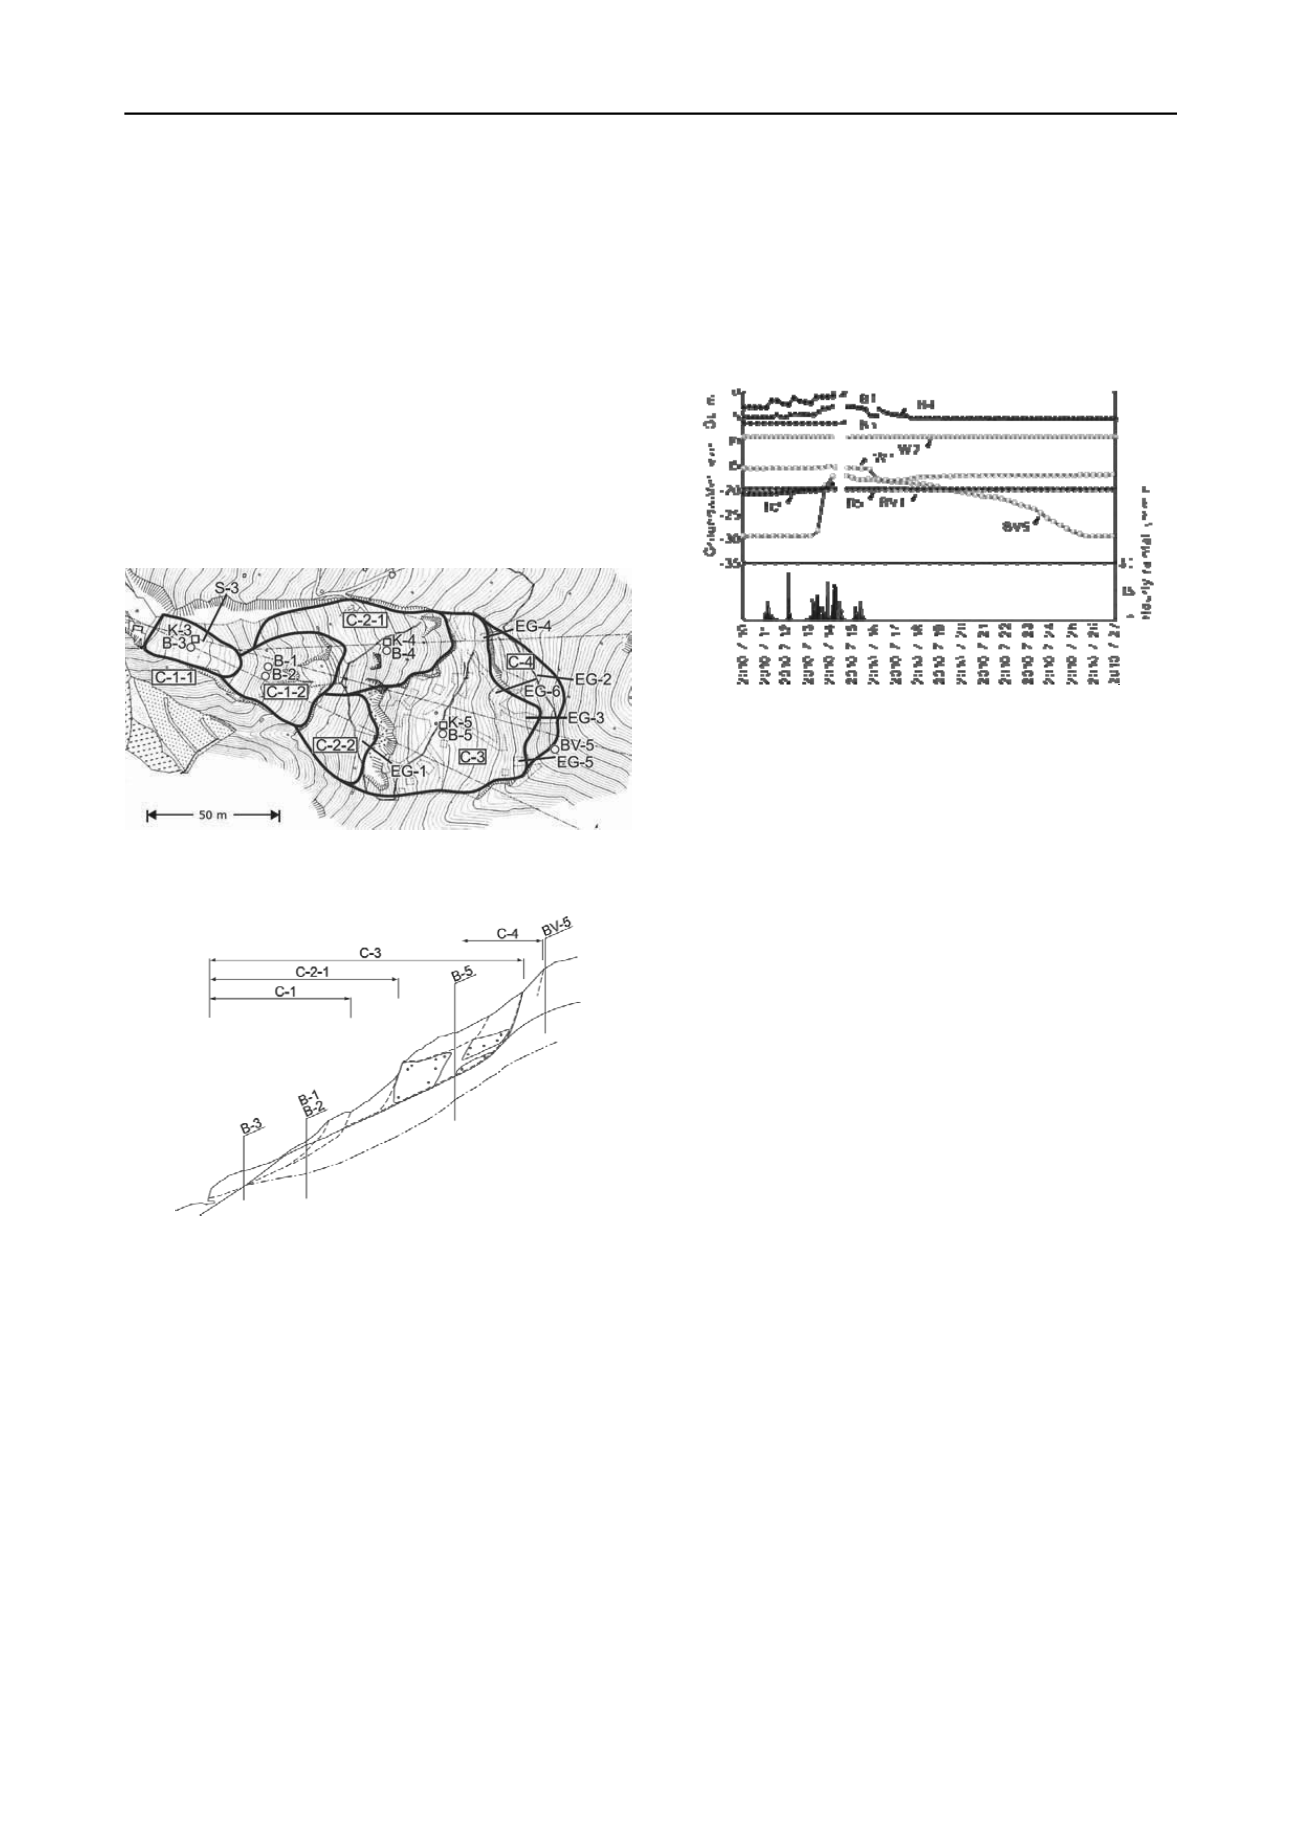
Figure 5 Plane view with failure blocks and measurement points ( “C”
represenrts failure block, “S” and “EG” are extensometers, “B” and
“BV” are observation wells and “K” are for inclinometers )
Figure 6 Cross section with failure block and measurement points
Three types of countermeasures were implemented to
mitigate slope failure. Firstly the top third of the slope was
covered with rubber sheeting to prevent inflow of rainwater.
Secondly, water head relief tubes were installed below the area
covered by the rubber sheets. And thirdly, a debris flow
protection gallery was built over the road in front of the
collapsed slope. This gallery was designed to resist an
overburden of 4m thick of debris.
4
RAINFALL RECORD AND FAILURE PROCESS
As shown in Figure 7, the rainfall commenced at 22.00 on
10/7/10 with a maximum recorded intensity of 25 mm/hr. At the
time of failure, i.e. 5:00 on 10/7/14, the rainfall rate of 18
mm/hr on 7/12 led to a cumulative rainfall of 269mm. By 10:00
on 7/15 the accumulated rainfall was 351mm. The first failure
occurred at 5:00 on 7/14 at the lower slope area C-1-2 over a
slope length of 80m, width of 50m and depth of 2m. The total
volume of the slip was 1600m
3
. The second failure occurred
between 15:00 on 7/14 and 10.00 on 7/15 at Block C-2-1 over a
slope length of 30m, width of 35m and depth of 2m. With these
failures, the lower part of the slope was covered by a 2m to 3m
thick layer of debris. This layer was unstable and was liable to
flow failure under future heavy rainfall. The upper part of the
debris deposit had a vertical slope face. Also a visible
continuous crack on the topside of block C-3 was discovered.
This means higher potential for further movement of this block
under the next heavy rainfall. So the stability of blocks C-2-2
and C-3 was worsened by the rainfall in July 2010.
Figure 7 Variation of ground water level in July 2010
5
GROUND WATER LEVEL RECORD
B1 and B2 were located in Block C-1-2. The elevation of GWL
firstly occurred in B1 following the rainfall as shown in Figure
7. The GWL rose to within 0.51m below ground level (BGL).
In the case of B2 the GWL rose to 18.54m BGL before the first
failure, which represented a rise of 3m from the dry period. In
previous failures in 1991 and 1994 similar GWL observations
were made. It is therefore thought that the GWL was the trigger
for the series of failures. The GWL in C3 had not apparently
risen above normal levels.
BV-5 was located at the top of the slope and recorded a
significant rise in GWL which correlated to the failure of C-3.
During the dry period the GWL was at a depth of 29m. The
GWL rose from 12:00 on 7/13 reaching a depth of 17.35m
BGL at the initiation of failure and started to fall slowly again
after 17:00 on 7/14. From 7/14 to 7/21 the rate of decrease was
between 0.3m and 0.8m/day and from 7/22 to 7/25 the rate was
1.85m/day, finally reaching 29m BGL on 7/25. The movement
of the extensometers stabilised when the ground water level
dropped to 20m BGL. B4 was located at the top of the C-2-1
block. The GWL rose to 2.03m BGL which was a 3.5m rise.
The rate of decrease was more than BV5 and on 7/17 it fell to
5m BGL. The major movement of Block C3 was considered to
be the result of the earlier failure of C1-2 and C2-1 which
effectively unloaded the toe of C3.
6
GROUND MOVEMENT
Before the rainfall there were no indications of movement from
the monitoring system located in Block C-3. However after the
second failure, movement of the C-3 block was observed with
rising GWL. After the first failure the monitoring system failed
to work for a temporary period of time and was reinstated at
15.00 on 7/14. At this time it was noted that Block C-3 was
moving at a rate of 30 mm/hr. This movement was monitored
by the inclinometers at K-3. According to the inclinometer data,
the slip surface was located at a depth of 20m. The movement at
the surface was the same as that at depth, indicating that Block
C-3 was moving as a single mass. From 7/15 the rate of
movement decreased from 15 mm/hr to 1 mm/hr on 7/19,
coming to a virtual halt on 7/22. This decrease correlated with
the decrease in GWL. The S-3 extensometer became inactive
due to the failure. No movement was observed by the
extensometers EG1 and EG2 as shown in Figure 8. Movement
was measured by EG3, EG4, EG5 and EG6 after 17.00 on 7/14
with greater than full-scale readings.


