2239
Technical Committee 208 /
Comité technique 208
strength loss. As time passes, the progression of soil self-
healing will result in increased shear strength compared to
shortly after the earthquake. Temporal changes of soil proper-
ties are known to have an effect on the rainfall thresholds re-
quired to trigger landslides (Tang et al. 2009). Due to the de-
creased soil strength, landslide-triggering rainfall thresholds
decrease compared with their pre-earthquake values (Lin et al.
2004).
A proposed methodology is presented for estimating tempo-
ral changes in soil strength related to landslide-triggering rain-
fall thresholds after an earthquake over a wide area (a few
square kilometers). This methodology is based on response
analysis with a deterministic, spatially distributed model that
combines a 1-D transient infiltration model with a safety-factor
analysis for calculating rainfall threshold.
After an earthquake, an abundance of loose landslide debris
can be present on the hillslopes. The potential failure surface
typically lies at or near the contact between the relatively per-
meable colluvium and the relatively impermeable underlying
bedrock. The thickness of the soil cover is small compared with
the length of slope, thus the infinite slope stability model can be
performed to evaluate slope stability. Limit equilibrium condi-
tions are reached at a certain depth when the mobilized shear
stress (a function of soil unit weight, failure surface depth and
slope angle) equals the soil shear strength, given by the Mohr-
Coulomb failure criterion (Eq. 4):
Eq.(4)
where
c
’ and
φ
are the effective cohesion and friction angle
of the soil,
d
b
is the depth of the failure surface,
α
is the slope
angle,
γ
s
is the soil unit weight
γ
w
, is the specific weight of wa-
ter, and
ψ
is the pressure head at the failure surface.
The limiting value of the pressure head which leads a slope
with given geometrical characteristics and soil properties to
limit equilibrium conditions can be calculated from Equation 5
as:
Eq.(5)
For a saturated soil cover, the evolution of the pressure head
with time and depth inside the slope is governed by the follow-
ing one-dimensional conservation equation (Eq. 6) (Iverson
2000):
Eq.(6)
where
Z
is the depth of the point considered with respect to
an horizontal reference plane;
D=D
0
/cos
2
α
and
D
0
is the hy-
draulic diffusivity of the soil.
Two factors,
fs
and
fi
, which are respectively reduction fac-
tors of soil shear strength and critical rainfall intensity, are now
introduced. It is assumed that the effective cohesion and tangent
of effective internal friction angle have the same reduction fac-
tor
fs.
The reduction factor of critical rainfall intensity is calcu-
lated by dividing the reduced rainfall intensity
I
reducrit
due to soil
shear strength reduction by the original critical rainfall intensity
I
critic
(Eq. 7):
Eq.(7)
For sandy soil, where the cohesion is zero, i.e. c = 0, an ap-
proximation solution is given by Eq. 8:
Eq.(8)
tan 1
tan '
tan 1
tan '
s
b
b
w
S
I
s
b
b
w
d
d
f
f
d
d
w
w
d
d
3 RESULTS
3.1
Study area: MATRIX virtual region
The case presented below is used to demonstrate the capabilities
of the model in terms of hazard assessment. It is not a validation
of the performance of the model. The case partly makes use of
artificial data (including the digital elevation model) and partly
typical engineering values (as for the soil parameters and rain-
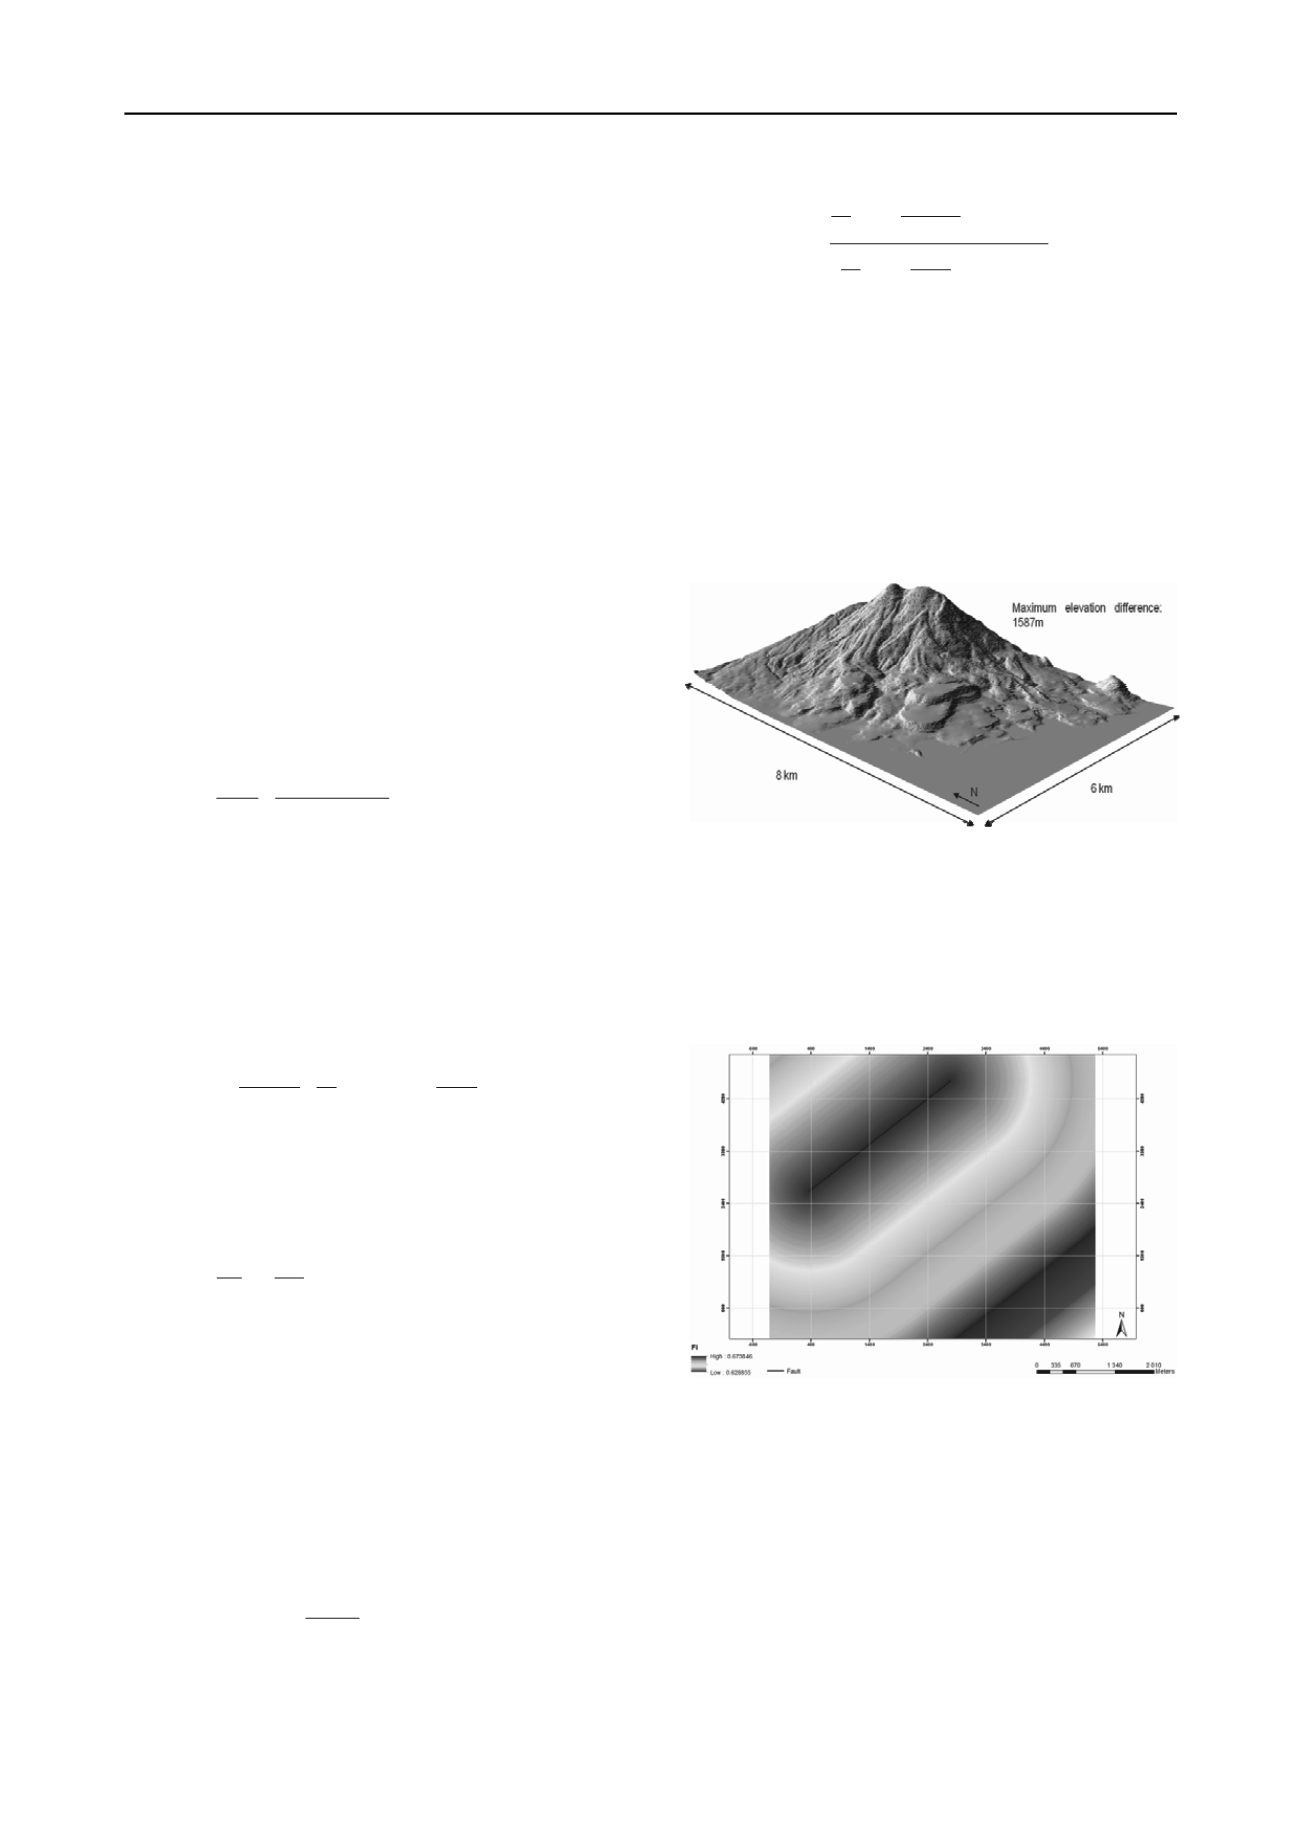
fall intensity). A digital elevation model (DEM) has been devel-
oped for demonstration of the landslide hazard model (Fig. 3)
'
'
'
tan
tan
tan
sin cos
w
s b
c
d
1
Fig. 3 3D representation of digital elevation model (DEM) for the case
study region.
3.2
Reduction factor for critical rainfall intensity
Figure 4 shows the results of the reduction factor inside the vir-
tual region for a sandy soil where the earthquake event has a
magnitude of 6.98 with a fault length of 3.08 km. The time span
after the earthquake is assumed to be 45 days.
'
2
lim
tan
cos 1
tan
tan
s
b
w
w
c
d
'
'
2
2
D
t
Z
Fig. 4 Rainfall threshold reduction factor
(fi)
as a function of time, magni-
tude and distance to the fault.
The temporal model represents the remaining threshold re-
duction as a function of time after the earthquake. The remain-
ing threshold reduction is represented by a normalized function
with values between 0 and 1. Value 1 corresponds to the maxi-
mum rainfall threshold reduction (i.e. the rainfall threshold re-
duction immediately after the earthquake) and value 0 corre-
sponds to no remaining rainfall threshold reduction (i.e. after
long time, when the occurrence of the earthquake has no effect
on the rainfall threshold.) The effect from the earthquake on the
rainfall threshold reduction is included in the spatial model.
Reducrit
I
crit
I f
I


