2172
Proceedings of the 18
th
International Conference on Soil Mechanics and Geotechnical Engineering, Paris 2013
as an approximately 230-m-long, 75-m-wide and 24-m-deep
translational soil and rock landslide with nested rotational
failures (Alan Kropp and Associates 2009).
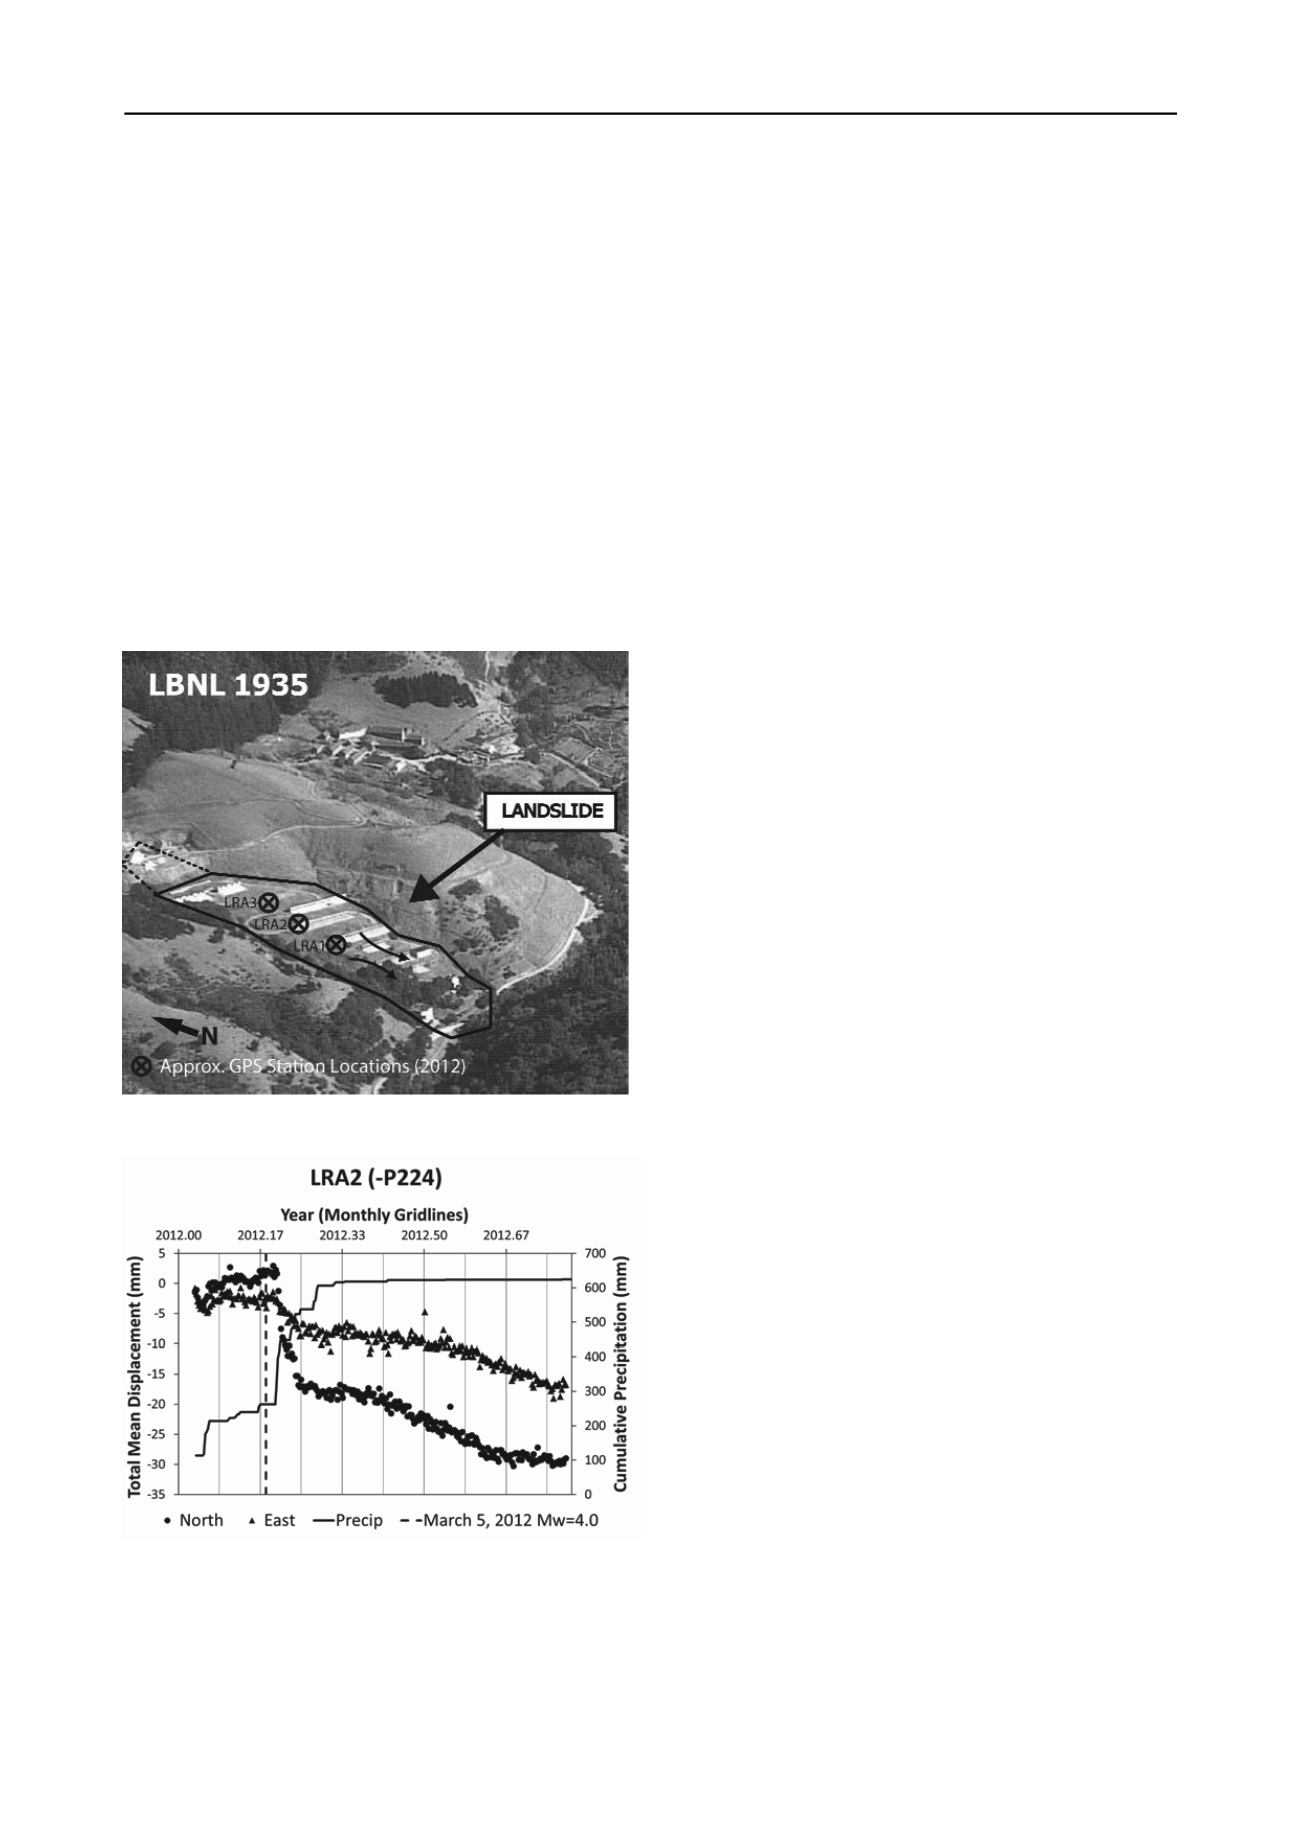
Already, a clear signal at each of these 3 stations is
apparent, showing down-slope displacements of up to 3 cm
which occurred directly related to local precipitation. As an
example, Figure 5 illustrates the time history of daily solutions
for station LRA 2 from January through October 2012, plotted
against cumulative rainfall. To remove tectonic related
displacements and measure actual displacement of the station,
daily solutions for the station’s North and East baselines are
taken with respect to a fixed station (P224) several kilometers to
the South. As such, LRA-2 clearly exhibits long term down-
slope displacement to the southwest, accelerating during large
rainfall events. Also indicated in Figure 5 is the time of the
March 5, 2012 M
w
= 4.0 Hayward fault earthquake with
epicenter in El Cerrito, CA, approximately 10 km north of the
site. While no clear seismically driven permanent slope
displacements can be discerned, this may be due to the “dry”
state of the landslide as well as the event’s size and distance.
7 CONCLUSION
A review of three independent InSAR time series analyses of
the Berkeley Hills, from separate satellite acquisitions and over
different time intervals from 1992-2011 shows remarkable
consistency. In each case, similar mean landslide velocities
were estimated, and precipitation dependent displacement
behavior was observed. Though we were not able to document
any motions induced by recent moderate earthquakes in the
region, improved spatial resolution has allowed us to draw
preliminary conclusions on the mechanics of displacement
within one landslide. Further insight is expected as the quality
of analysis improves and larger datasets are acquired.
After a mild wet season, the GPS instrumentation of several
landslides in the Berkeley Hills, has recorded well-defined
precipitation triggered slope movement. In contrast, the
occurrence of a nearby M
w
= 4 earthquake did not appear to
have produced a measurable effect. Overall, the system has
already demonstrated its capability to record landslide motions
that otherwise would not have been observed with such level of
detail and it continues to function and collect new data.
While both methods of observation presented here have not
yet been directly compared, they do exhibit similar trends. In
both cases, records of landslide related surface displacement
have comparable down-slope velocities, increased with periods
of precipitation and varied with its intensity. Observations over
longer periods will provide important insight on the triggering
mechanisms and internal landslide behavior we have described.
8 ACKNOWLEDGEMENTS
We gratefully acknowledge our financial support from the
Lawrence Berkeley National Laboratory, Earth Science
Division Director’s Fund.
Figure 4. 1935 Oblique view of LBNL landslide with current GPS
station locations.
9 REFERENCES
Alan Kropp and Associates 2002. Blakemont Area Geologic Study, El
Cerrito and Kensington CA.
Report
. Berkeley. CA.
Alan Kropp and Associates 2009. Geologic and Geotechnical
Investigation Report, Helios Energy Research Facility, University
of California Berkeley, Berkeley CA.
Report
. Berkeley. CA.
Ferretti A., Fumagalli A., Novali F., Prati C., Rocca F., Rucci A. 2011.
A New Algorithm for Processing Interferometric Data-Stacks:
SqueeSAR.
IEEE Geoscience and Remote Sensing
49(9), 3460-
3470.
Giannico C. and Ferretti A. 2011. SqueeSAR
TM
Analysis Area:
Berkeley.
Processing Report
. Tele-Rilevamento Europa, Milano,
IT.
Hilley G.E., Bürgmann R., Ferretti A., Novali F. and Rocca F. 2004.
Dynamics of Slow Moving Landslides From Permanent Scatterer
Analysis.
Science
304, 1952-1955.
Quigley K. C., Bürgmann R., Giannico C. and Novali F. 2010. Seasonal
Acceleration and Structure of Slow Moving Landslides in the
Berkeley Hills. Proceedings of the Third Conference on Earthquake
Hazards in the Eastern San Francisco Bay Area; edited by Keith
Knudsen
. California Geological Survey Special Report 219
, 169-
178.
Figure 5. GPS position time series of station LRA 2 with respect to
reference station P224. North (circles) and east (triangles) components
of relative displacement with respect to reference site P224 are show
together with cumulative precipitation (solid line) and time of M
w
= 4
earthquake (dashed line).


