2179
Technical Committee 208 /
Comité technique 208
Proceedings of the 18
th
International Conference on Soil Mechanics and Geotechnical Engineering, Paris 2013
model the sensitive clay using Eq. 2 are also shown in Table 1.
These parameters are estimated based on the laboratory tests
conducted on sensitive clays (e.g. Tavenas et al., 1983) and the
interpretation of test data and constitutive model development
by other researchers (e.g. Bernander 2000, Leroueil 2001,
Locat et al. 2008, Quinn 2009, Locat et al. 2011).
4. FINITE ELEMENT RESULTS
4.1
Propagation of shear band
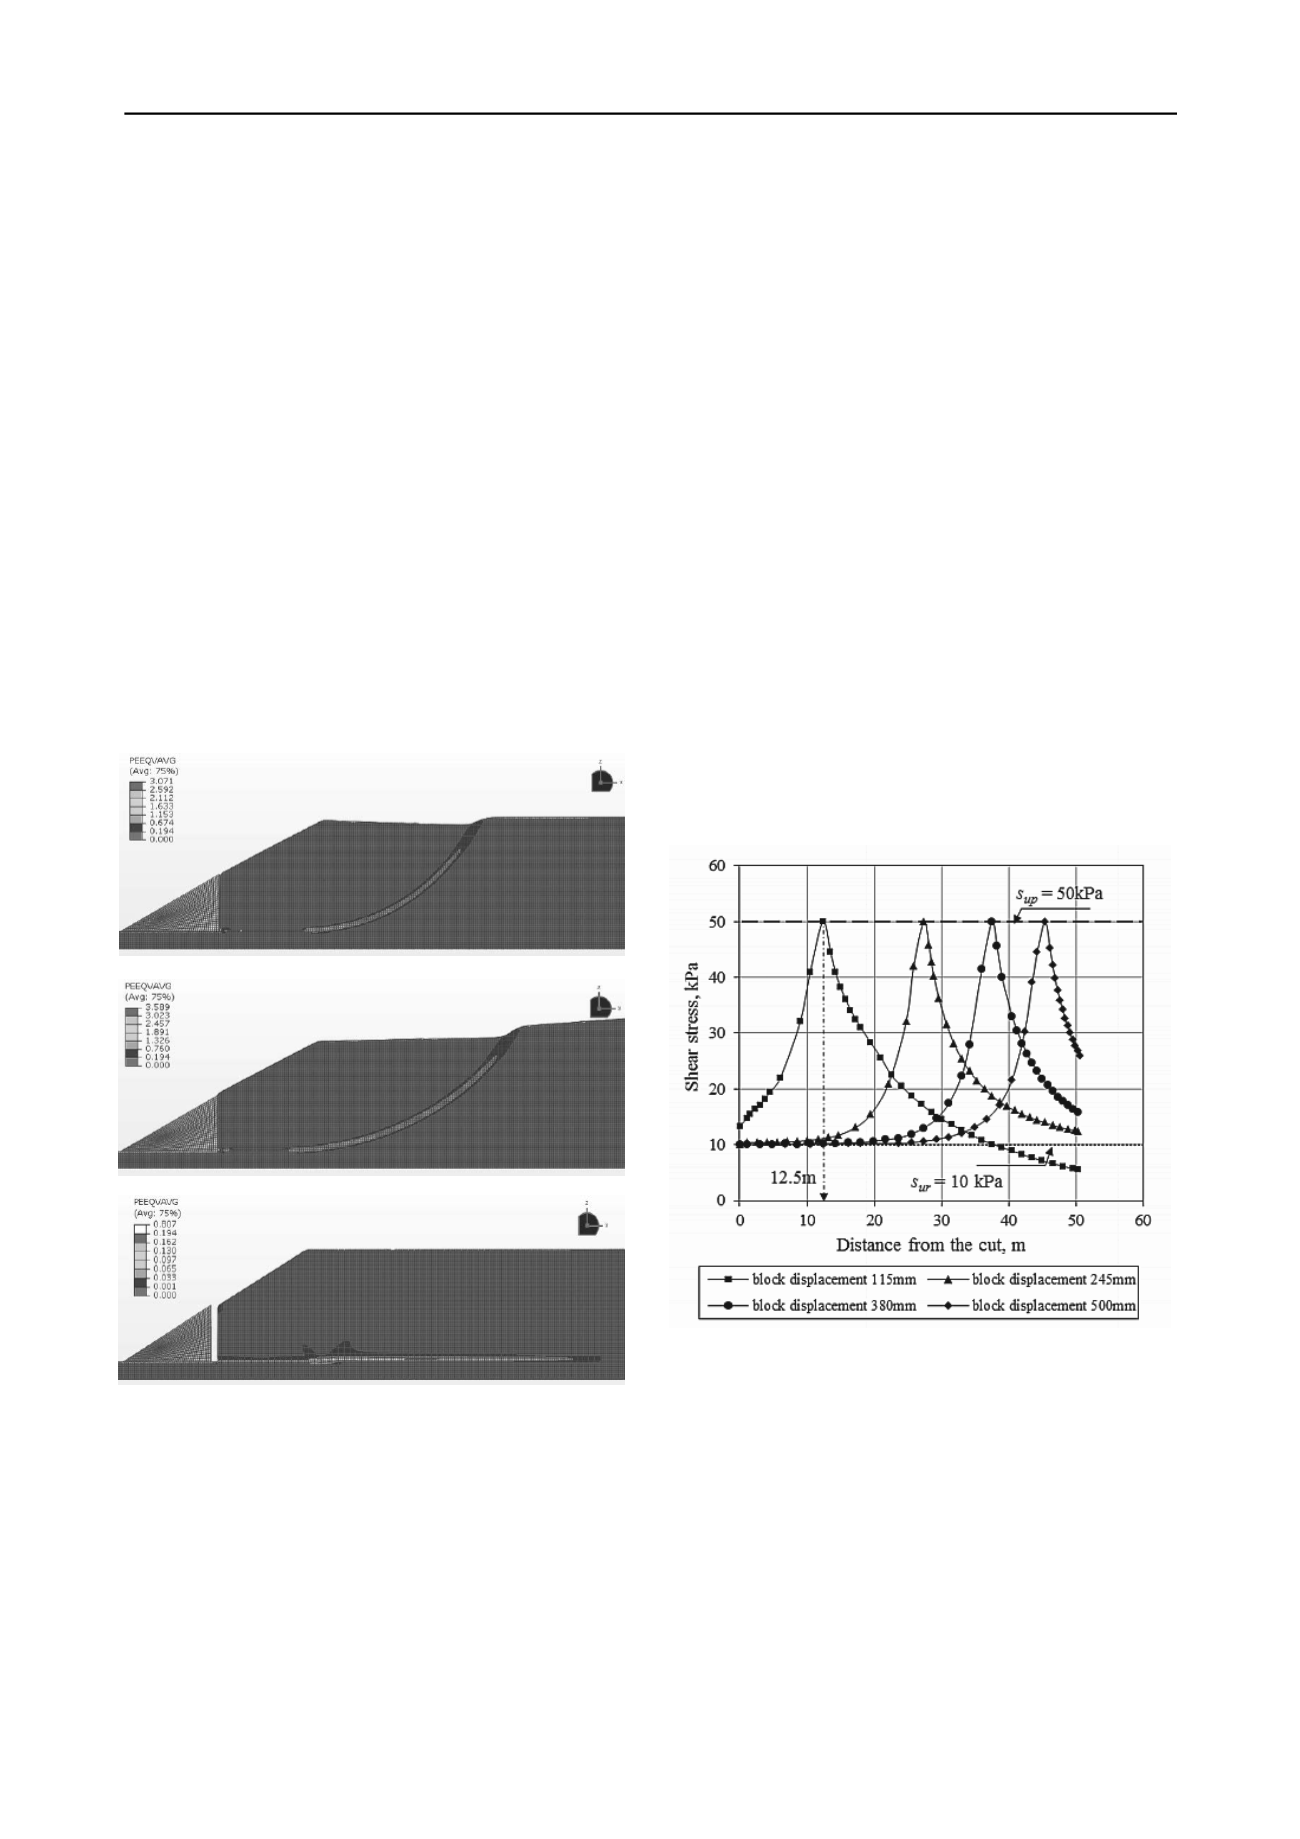
Figure 2 shows the variation of equivalent plastic shear strain
for three cases. In Cases-I & II the shear band initially
propagates horizontally and then curved upward resulting in
global failure. The failed soil mass follows the
excavated/eroded soil block. Figures 2(a) & 2(b) show the
equivalent plastic shear strain when the plastic shear strain in
the entire failure plane is greater than γ
p
95
. Global failure does
not occur in Case-III (Fig. 2c). There is an approximately 1.4 m
gap between the vertical face of the block and soil mass at the
right. The shear band propagates horizontally and finally ended
at certain length. Figure 2(c) also shows the plastic shear strain
when the shear band propagation is ended. Whether the shear
Figure 2. Developed equivalent plastic strain in the softening layer in
case I, II and III respectively
band will propagate upward and cause the global failure or not,
depends on the shear strength of the upper soil layer and
mobilized shear strength along the shear band. For the soil
properties and geometry used in the present study the failure
pattern is almost same for Cases-I and II. However, the released
energy from the excavated/eroded soil block is not sufficient to
move the shear band upward in Case-III to cause the failure of
the slope.
The equivalent plastic shear strain, denoted by the symbol
PEEQVAVG in Fig. 2, is related to γ
p
as PEEQVAVG= γ
p
/ .
According to Eq. (2), when γ
p
γ
p
95
(=33%), that means
PEEQVAVG=0.194, the undrained shear strength is less than
12 kPa (=50-0.95(50-10)). Figure 2(c) shows that the equivalent
plastic shear strain greater than 0.194 is developed in the shear
band only near the vertical face of excavated/eroded block in
Case-III. However, the equivalent plastic shear strain greater
than 0.194 is developed in the entire length of the failure plane
in Case-I & Case-II. Therefore, the failure of the slope is
occurred in both cases at residual shear strength on the failure
plane as large strain is developed.
4.2
Shear stress and mobilized shear strength
The Case-III is considered for further examination of the
development of shear stress and mobilized shear strength along
the potential failure plane. Figure 3 shows the variation of shear
stress along the failure plane with movement of
excavated/eroded block. Shear stress for four displacements
(115 mm, 245 mm, 380 mm and 500 mm) are shown. In order
to explain the process, consider the shear stress on the potential
failure plane for the block displacement of 115 mm. The
maximum shear stress (50 kPa) is developed at 12.5 m from the
vertical face of the cut. The shear stress between 0 to 12.5 m is
less than 50 kPa (i.e. s
up
) and greater than 10 kPa (i.e. s
ur
). That
means, 0-12.5 m of the shear band represents the post-peak
softening zone where the reduction of shear strength is occurred
because of plastic strain as Eq. 2, and the mobilized shear
strength is in between the peak and residual shear strength of
the soil. In the right side of the peak (i.e. distance greater than
12.5 m) the shear stress is again reduced with distance. For this
displacement of the block (115 mm), the shear stress in the
Figure 3. Shear stress along the potential failure plane
potential failure plane at a distance greater than 12.5 m is not
increased to the peak, and therefore it represents the pre-peak
behavior. At a very large distance, the shear stress is reduced to
zero in Case-III as the ground surface is horizontal. The pattern
of shear stress development for any other displacement of the
block is similar as shown in Fig. 3. The location of the peak
shear stress shifts to the right with increase in block
displacement; that means a greater length of the potential failure
plane is in post-peak stress-strain condition. For example, for
500 mm block movement the peak is occurred at 45.5 m and
therefore 0-45.5 m is in post-peak condition with approximately
30 m in residual shear strength level. This process will be
continued until the shear band propagation is ended for stable
slopes as in Case-III. However, if the failure is occurred, as in
Case-I and II, the large plastic shear strain will reduce the shear


